Book Appointment Now

Egypt Country Profile: Prepared with data from the World Bank, IMF, UNDP, UNESCO, Central Bank of Egypt, Export Promotion Bureau (Bangladesh) and Bangladesh Bank
1. GEOGRAPHICAL LOCATION AND POLITICAL SYSTEM OF EGYPT
Strategic Geographic Position of Egypt
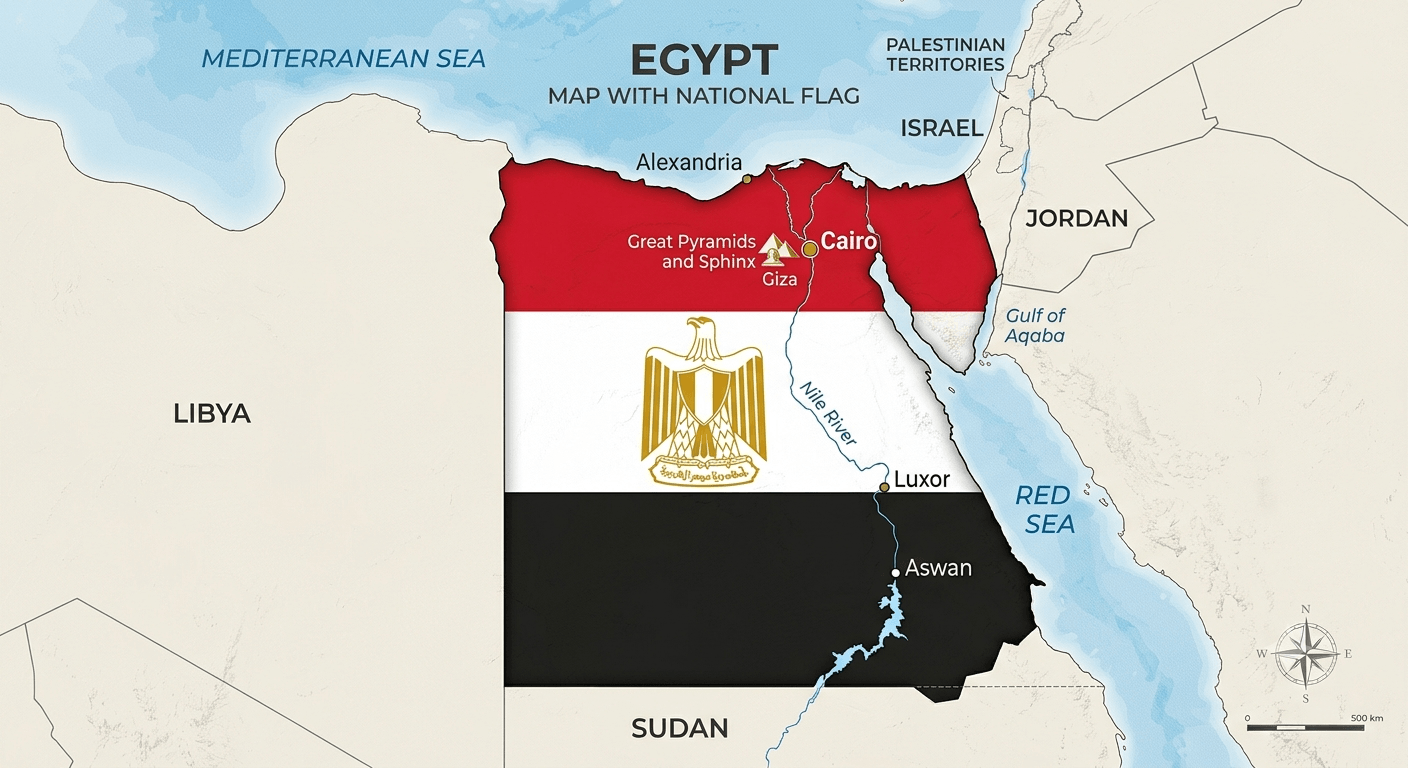
The Arab Republic of Egypt (جمهورية مصر العربية) occupies a truly unique strategic position at the crossroads of Africa and Asia, controlling the Suez Canal — one of the world’s most critical maritime chokepoints connecting the Mediterranean Sea to the Red Sea and Indian Ocean. This geographical endowment has made Egypt a global trade nexus for millennia[1].
Key Geographic Features:
- Total Land Area: 1,001,450 square kilometers — the 29th largest country globally
- Strategic Waterways: The Suez Canal (193 km), connecting Mediterranean to Red Sea, handles ~12% of global trade
- The Nile River: Africa’s longest river, flowing 1,550 km through Egypt, sustaining 95% of the population along its banks and delta
- Coastlines: Mediterranean coast (north) and Red Sea coast (east) — dual sea access
- Neighboring Countries: Libya (west), Sudan (south), Gaza Strip and Israel (northeast), Saudi Arabia and Jordan (across the Red Sea)
- Climate: Predominantly arid desert climate; Mediterranean climate along the northern coast
Population: Approximately 116.9 million (2025 estimate) — the most populous nation in the Arab world, third most populous in Africa, and 14th globally. Egypt’s population grows at roughly 1.4% annually[2].
Capital: Cairo — the largest city in the Arab world and Africa, with a metropolitan population exceeding 22 million. The New Administrative Capital (opened 2019, approximately 45 km east of Cairo) is gradually assuming governmental functions[1].
Strategic Geographical Significance:
- Suez Canal Revenue: Egypt earned ~US$9.4 billion in Suez Canal revenues in FY2024-25, recovering from the Houthi-related transit decline
- Gateway Position: Serves as the logistics gateway connecting Europe, Asia, and Africa
- Energy Corridor: Critical role in regional natural gas and oil transportation
- Trade Hub: Member of key Middle Eastern and African trade blocs[1]
Sources: CIA World Factbook: Egypt 2026 | CAPMAS Central Agency for Public Mobilization and Statistics
Egypt Government and Political System
Official Name: Arab Republic of Egypt (جمهورية مصر العربية)
Government System: Egypt operates as a semi-presidential republic under the 2014 Constitution (amended 2019), balancing executive authority between the President and a Prime Minister-led cabinet[3].
Head of State: President Abdel Fattah el-Sisi (in office since June 2014; re-elected 2018 and 2024 for a term extending to 2030)
Head of Government: Prime Minister Mostafa Madbouly (serving since June 2018)
Legislative Structure:
- Senate (Majlis Al-Shuyukh): 300 seats, established 2019 under constitutional amendments
- House of Representatives (Majlis Al-Nawab): 596 seats, unicameral legislative body with dominant authority
- Electoral System: Mixed first-past-the-post and party-list proportional representation
Administrative Divisions: 27 governorates, each led by a governor appointed by the President
Key Political Characteristics:
- Presidential Dominance: Strong executive authority retained by the presidency over key policy areas
- Economic Reform Agenda: Inauguration of the 2024-2030 national economic strategy including IMF-supported reforms
- Regional Leadership: Egypt’s pivotal role in Arab League, African Union, and Middle Eastern diplomacy
- Security Priorities: Military and internal security institutional dominance[3]
Source: Egyptian State Information Service (SIS) official government portal
2. EGYPT COUNTRY PROFILE ECONOMIC OVERVIEW: AFRICA’S RESILIENT ECONOMIC POWERHOUSE
The Egypt country profile reveals an economy of continental significance — the third-largest in Africa by nominal GDP (after Nigeria and South Africa) and the most diversified in North Africa. The economy combines substantial agricultural, industrial, and services sectors with strategic tourism and Suez Canal revenue streams[4].
Egypt Key Economic Indicators (2024-2026)
This Egypt country profile economic analysis documents a challenging recovery phase characterized by currency stabilization efforts and IMF-supported reform programs.
| Economic Indicator | 2024 | 2025 Estimate | 2026 Forecast | Source |
|---|---|---|---|---|
| Nominal GDP | ~US$322.7 billion | ~US$352.6 billion | ~US$385.0 billion | Ministry of Planning/IMF[5] |
| Real GDP Growth | 2.4% | 4.0% (projected) | 4.5% (projected) | World Bank/IMF[5] |
| GDP Per Capita (US$) | ~US$2,750 | ~US$2,950 | ~US$3,200 | World Bank[5] |
| Inflation Rate | 33.9% (peak Dec 2023) | ~14-16% (declining) | ~10% (target) | CAPMAS/CBE[6] |
| Unemployment Rate | ~6.7% | ~6.5% | ~6.3% (target) | CAPMAS[5] |
| Youth Unemployment (15-24) | ~17.5% | ~16.8% | ~15.9% (target) | CAPMAS[5] |
| Current Account Balance | -6.3% of GDP | -4.5% of GDP | -3.8% of GDP | IMF[5] |
| Foreign Exchange Reserves | US$46.9 billion | US$52.0 billion | US$57.0+ billion | Central Bank of Egypt[6] |
| Government Debt (% GDP) | ~96.0% | ~91.5% | ~88.0% | IMF Article IV[5] |
| Credit Rating (S&P) | B- (stable) | B (stable improvement) | BB- (target) | S&P Global Ratings[7] |
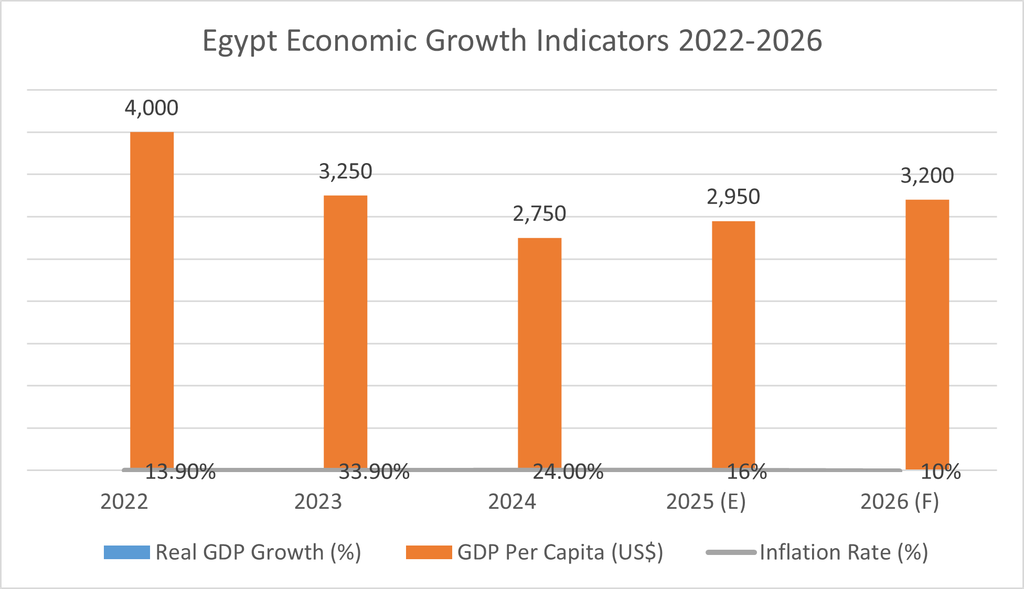
Egypt Economic Transition Note: The Egypt country profile shows a dramatic economic adjustment. Egypt’s currency (Egyptian Pound, EGP) underwent significant devaluation from ~31 EGP/USD to ~50 EGP/USD during 2024, triggering inflation reaching 33.9% at peak. However, by late 2025, inflation had declined to ~14-16% as the currency stabilized. IMF’s US$8 billion Extended Fund Facility (EFF) anchor supports ongoing fiscal reform[5].
Growth Rebound: Following three consecutive years of moderated growth (2.4% in FY2024), Egypt’s economy projects 4.0% in FY2025 and 4.5% in FY2026 — driven by gas exports recovery, tourism resilience, and infrastructure investment momentum[5].
Source: Central Bank of Egypt Economic Research Papers 2025 | IMF Article IV Consultation Egypt Press Release 2025 | World Bank Egypt Economic Monitor 2025 | Central Bank of Egypt | S&P Global Ratings Egypt Sovereign Rating
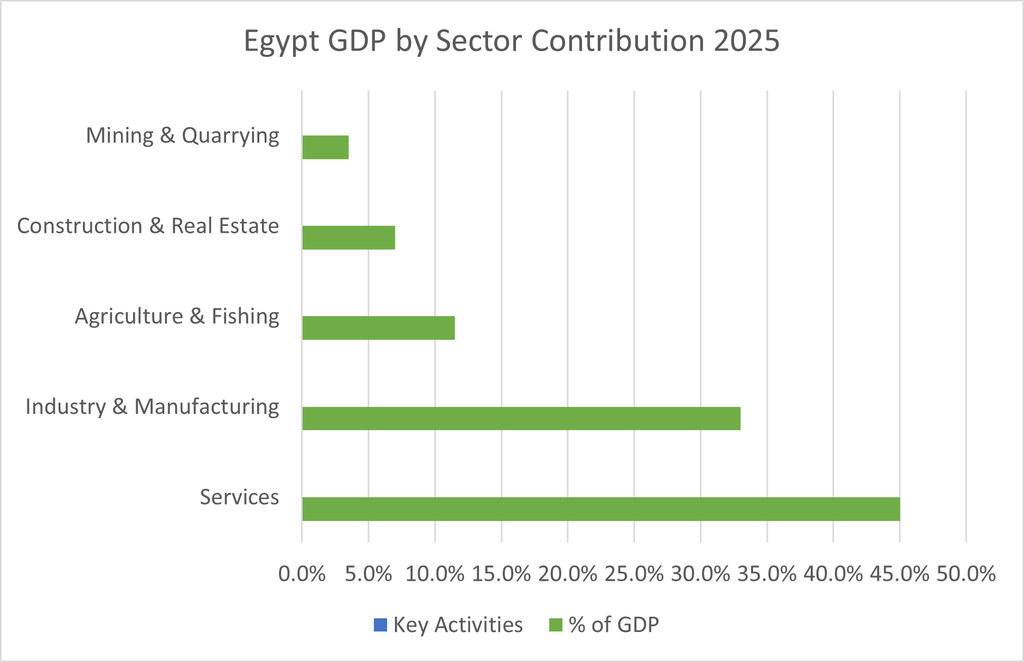
Egypt Sectoral Contribution to GDP (2024-2025)
The Egypt country profile documents a well-diversified economic structure with services leading, industry strong, and agriculture significant.
| Sector | % of GDP | Key Activities | Growth Trend | Egypt Country Profile Competitive Advantage |
|---|---|---|---|---|
| Services (Tourism, Finance, Telecom, Suez Canal) | 45.0% | Tourism, banking, telecom, retail, Suez Canal, IT/BPO | Tourism recovery strong; IT/BPO fastest growing | Young skilled workforce, competitive labor costs |
| Industry & Manufacturing | 33.0% | Oil & gas refining, textiles, chemicals, automotive, cement, steel | Moderate recovery post-2024 | Large domestic market, Free Zone system |
| Agriculture & Fishing | 11.5% | Cotton, sugar, rice, fruits, vegetables, poultry | Stable, weather-dependent | Nile irrigation, long growing seasons |
| Construction & Real Estate | 7.0% | Infrastructure, residential, commercial, new cities | Government-led infrastructure boom | New Administrative Capital projects |
| Mining & Quarrying | 3.5% | Natural gas, crude oil, phosphate, gold | Gas production recovery | Expanding gas & gold exploration |
Total GDP at Current Prices: ~EGP 12.5 trillion (~US$352.6 billion at ~35.5 EGP/USD)
Key Economic Strengths in Egypt Country Profile:
- Strategic Waterway: Suez Canal generated US$9.4 billion in FY2024-25 despite geopolitical disruptions — a key strategic revenue stream
- Tourism Renaissance: 15.75 million visitors in 2024 (surpassing 2010’s 14.7 million record), targeting 18 million by 2026
- Natural Gas Hub: Zohr gas field (largest in Mediterranean) and growing LNG export capacity position Egypt as regional energy leader
- IT/BPO Sector: US$3.7 billion in IT outsourcing revenues annually, growing at 15-20% — one of Africa’s fastest growing tech destinations
- Industrial Base: Africa’s largest cement producer and second-largest automotive assembler (after Morocco)
Source: Egyptian Ministry of Planning and Economic Development Economic Indicators Dashboard | Central Bank of Egypt Sectoral Reports | CAPMAS Sectoral Statistics
3. EGYPT EXPORT AND IMPORT STRUCTURE IN THE EGYPT COUNTRY PROFILE CONTEXT
Egypt Export Performance (2024-2025)
| Product Category | Export Value | % Egyptian Exports | Key Markets | Growth Trend |
|---|---|---|---|---|
| Petroleum & Natural Gas | US$16.8 billion | 31.0% | Turkey, EU, Gulf states | Gas exports recovering; LNG expansion |
| Non-Oil Exports (Manufactured) | US$11.4 billion | 21.0% | EU, US, Africa, Gulf | Industrial growth strategy focus |
| Gold & Precious Stones | US$4.5 billion | 8.3% | Switzerland, UAE, Turkey | Rising gold exports |
| Textiles & Ready-Made Garments | US$3.2 billion | 5.9% | US, EU, Gulf | QIZ-enabled growth potential |
| Fruits & Vegetables | US$3.0 billion | 5.5% | EU, Gulf, Russia | Strong agricultural export base |
| Chemicals & Fertilizers | US$2.6 billion | 4.8% | EU, Asia, Africa | Competitive fertilizer exports |
| Iron & Steel | US$1.8 billion | 3.3% | Africa, Middle East | Regional steel leadership |
| Engineering Products | US$1.6 billion | 2.9% | Africa, Middle East | Emerging value-added exports |
| Other Products | US$1.5 billion | 2.7% | Various markets | Diversification push |
Total Egyptian Exports (FY2024-25): ~US$48.6 billion
Source: Egypt’s General Organization for Export and Import Control (GOEIC) 2025
Top Egypt Export Markets
| Country/Region | Egypt Export Value | % Total | Key Products |
|---|---|---|---|
| Turkey | US$5.2 billion | 10.7% | Petroleum, chemicals, textiles |
| United States | US$4.8 billion | 9.9% | Textiles (QIZ), petroleum, chemicals |
| Saudi Arabia | US$3.6 billion | 7.4% | Food, engineering, chemicals |
| Italy | US$3.1 billion | 6.4% | Petroleum, textiles, agro-products |
| UAE | US$2.9 billion | 6.0% | Chemicals, food, precious stones |
| Spain | US$1.8 billion | 3.7% | Petroleum, textiles, vegetables |
| Germany | US$1.6 billion | 3.3% | Textiles, chemicals, engineering |
| France | US$1.5 billion | 3.1% | Agro-products, chemicals, textiles |
| India | US$1.4 billion | 2.9% | Fertilizers, petroleum, chemicals |
| Netherlands | US$1.3 billion | 2.7% | Fruits, vegetables, flowers |
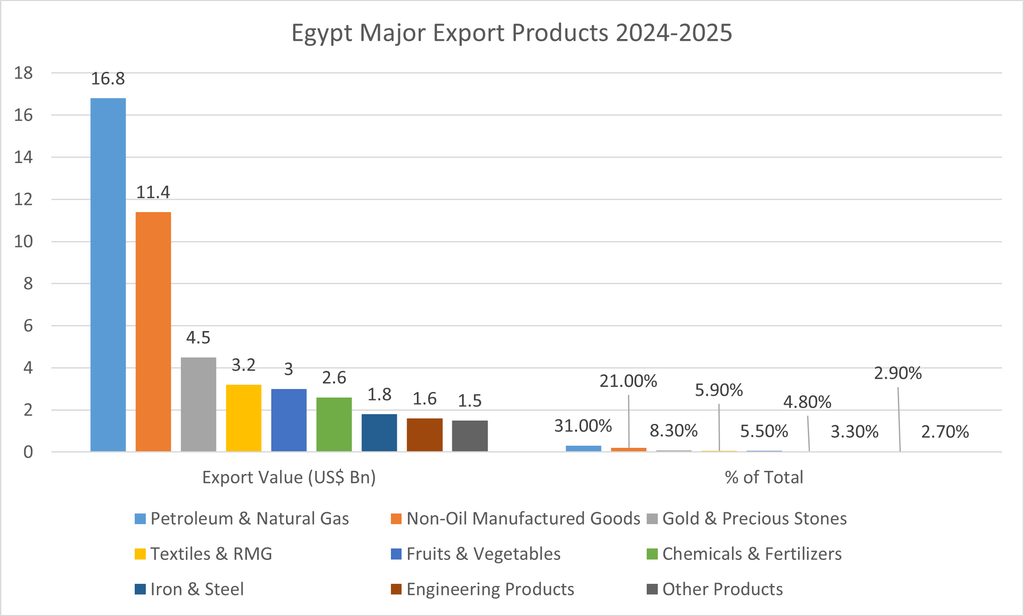
Egypt Country Profile Export Strategy: Egypt strategically prioritizes manufacturing and value-added exports through targeted industrial zones and quality infrastructure. The Qualifying Industrial Zones (QIZ) agreement with the US and Israel allows duty-free exports to the US for qualifying goods — a major attraction for textile manufacturers[8].
Egypt Import Profile (2024-2025)
| Product Category | Import Value | % Total | Primary Sources |
|---|---|---|---|
| Petroleum Products | US$14.2 billion | 16.0% | Saudi Arabia, UAE, Iraq, Kuwait |
| Machinery & Equipment | US$11.5 billion | 13.0% | China, Germany, Italy, US |
| Wheat & Cereals | US$5.6 billion | 6.3% | Russia, Ukraine, France, US |
| Electric Equipment | US$4.8 billion | 5.4% | China, Germany, US, Japan |
| Pharmaceuticals | US$3.9 billion | 4.4% | US, Germany, India, France |
| Vehicles & Parts | US$3.1 billion | 3.5% | China, Germany, Japan, US |
| Iron & Steel | US$2.7 billion | 3.0% | China, Turkey, Russia |
| Plastics & Polymers | US$2.2 billion | 2.5% | Saudi Arabia, US, China |
| Textile Yarns & Raw Materials | US$1.8 billion | 2.0% | China, India, Turkey, Bangladesh |
| Chemicals | US$1.4 billion | 1.6% | Germany, US, China |
Total Egyptian Imports (FY2024-25): ~US$74.8 billion
Egypt Country Profile Import Strategy: Egypt’s import policy actively promotes local manufacturing substitution through tariff escalation and local content requirements. Egypt imports significant raw materials, semi-finished goods, and industrial inputs to support its manufacturing sector — especially textiles, engineering, and chemicals[9].
Sources: Egyptian Ministry of Trade and Industry Trade Policy Reports | General Authority for Investment and Free Zones (GAFI) Egypt Investment Promotion
4. EGYPT EDUCATION SYSTEM AND HUMAN CAPITAL: A COUNTRY PROFILE ANALYSIS
The Egypt country profile education system reveals significant progress in enrollment alongside persistent quality and alignment challenges. Egypt maintains the largest education system in the Middle East and North Africa with over 25 million students.
Egypt Education Structure
- Primary Education: 6 years (compulsory, ages 6-11)
- Preparatory Education: 3 years (ages 12-14)
- Secondary Education: 3 years (ages 15-17), including general and technical/vocational tracks
- Higher Education: Universities, institutes, and technical colleges
- Language of Instruction: Arabic (official), English widely taught, French optional[10]
Egypt Education and Literacy Indicators
| Education Metric | Value (2024-25) | Trend | Egypt Country Profile Benchmark |
|---|---|---|---|
| Adult Literacy Rate | 71.8% (2023) | Steady improvement | Below some MENA peers; structural challenge |
| Youth Literacy Rate (15-24) | 92.5% (2023) | Strong improvement | Above adult rate — generational progress |
| Primary Enrollment Ratio | 99.2% (2024) | Near-universal | Excellent access achievement |
| Secondary Enrollment Ratio | 71.3% (2024) | Improving | Dropout remains concern |
| Tertiary Enrollment Ratio | 38.5% (2024) | Growing | Among Africa’s highest volume |
| Female Enrollment Parity Index | 0.97 (primary) | Near parity | Progressive gender balance |
| Female Enrollment Parity (Tertiary) | 0.95 | Strength | Particularly in STEM |
| Government Education Spending | 4.2% of GDP | Increasing commitment | Below reform targets |
| Public Universities | 28 government universities | Expanding access | Geographic distribution improving |
| Technical/Vocational Schools | 210+ institutes | Focus on skills alignment | Employment linkage priority |
| STEM Schools (since 2011) | 14 elite STEM high schools | Growing | Government investment priority |
Egypt Education Strengths:
- Scale: 25 million+ students enrolled — massive human capital base
- Institutional Depth: Cairo University, Alexandria University, Cairo Amman, American University in Cairo (AUC) among region’s finest
- STEM Investment: Dedicated STEM school program since 2011 producing top regional talent
- IT/BPO Alignment: Growing curriculum alignment with outsourcing industry needs[10]
Source: Egyptian Ministry of Education and Technical Education Strategic Plan 2024-2030 | UNESCO Institute for Statistics | World Bank Education Sector Reviews
5. EGYPT HEALTH AND SOCIAL WELFARE IN THE COUNTRY PROFILE FRAMEWORK
Egypt Key Health Metrics
| Health Indicator | Value (2024-25) | Trend | Egypt Country Profile Benchmark |
|---|---|---|---|
| Life Expectancy at Birth | 71.0 years | Improvement since 2020 | Above African average; below MENA north |
| Infant Mortality Rate | 14.5 per 1,000 | Significant decline | Below regional average |
| Maternal Mortality Ratio | 32 per 100,000 | Reduction target on track | Major progress (down from 43) |
| Healthcare Coverage | ~80% | Expanding through 100 Million Seha | Universal coverage ambition |
| Universal Health Coverage Index | 67.5/100 | Improving | Above African average (55) |
| Health Expenditure per Capita | US$200 (current) | Growing | Below regional average; reform area |
| Physicians per 10,000 | 8.5 (2023) | Improving | Urban concentration persists |
| Child Malnutrition (Stunting) | 21.5% (2024) | Persistently high | Critical rural challenge |
| Fully Immunized Children | 93% (2024) | High achievement | Meets WHO 90% target |
| Life Expectancy Urban-Rural Gap | ~5 years | Narrowing | Equity improvement underway |
Egypt Social Development Indicators
| Social Indicator | Value (2024-25) | Policy Context |
|---|---|---|
| Human Development Index (HDI) | 0.728 (2023) | “High human development” category |
| HDI Global Rank | 98th of 193 countries (2023) | Above African average |
| Gini Coefficient (Inequality) | 31.9 (2020) | Relatively low inequality |
| Poverty Rate (National) | ~29.7% (2024) | Declining from 32.5% (2018-19) |
| Extreme Poverty | ~4.5% (2024) | Targeted intervention programs |
| Youth Unemployment (15-24) | ~16.8% (2025) | Persistent challenge |
| Women in Parliament | 25.1% (2025) | Constitutional quota enabled |
| Internet Penetration | 72.2% (2025) | Growing 4G/5G infrastructure |
| Mobile Phone Penetration | ~121% (2025) | Multiple SIMs typical |
| Access to Electricity | 99.9% (urban), 99.2% (rural) | Near-universal |
| Access to Clean Water | 97.8% (urban), 90.5% (rural) | Rural access gaps remain |
Egypt Health System Evolution:
- 100 Million Seha (100 Million Healthy Lives): Major national health initiative launched 2018 providing screenings and treatment
- Hayah Karima (Decent Life): Landmark rural development initiative covering 4,700 villages
- Universal Health Insurance (UHIS): New comprehensive insurance system rolling out nationally by 2032, expanding coverage and improving health outcomes[11]
Source: Egyptian Ministry of Health and Population Statistical Reports 2025 | World Health Organization Eastern Mediterranean Regional Office | CAPMAS Social Indicators
6. BANGLADESH-EGYPT RELATIONS IN THE COUNTRY PROFILE CONTEXT
Diplomatic Framework and Institutional Cooperation
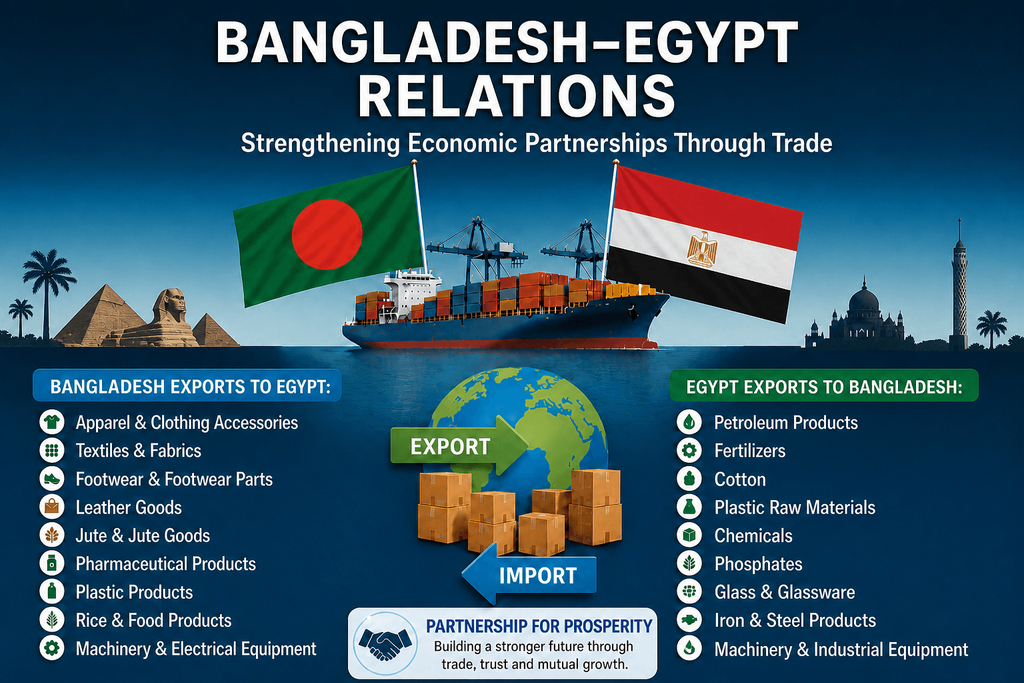
The Egypt country profile contextualizes longstanding diplomatic relations with Bangladesh, rooted in shared Islamic heritage and strengthened through active cooperation within multilateral frameworks — particularly the Organisation of Islamic Cooperation (OIC) and the G77. Both nations are founding members of the OIC and share substantial historical, cultural, and political ties[12].
Key Engagement Milestones:
- Diplomatic Relations: Established during Bangladesh’s early independence period (early 1970s) after Egypt’s recognition
- Embassy Presence: Bangladesh maintains an embassy in Cairo; Egypt maintains an embassy in Dhaka (established 2019)
- OIC Cooperation: Both active members, collaborating on Islamic solidarity and development issues
- Trade Delegations: Periodic bilateral business delegations and Chamber of Commerce exchanges
- UN Peacekeeping: Egypt and Bangladesh are among the world’s top contributors to UN peacekeeping missions
Bilateral Cooperation Platforms
| Platform | Bangladesh Role | Egypt Role | Egypt Country Profile Relevance |
|---|---|---|---|
| Egyptian Embassy in Dhaka (Est. 2019) | Hosting embassy; issuing visas | Active commercial/trade facilitation | Physical presence lowers transaction costs |
| Organisation of Islamic Cooperation (OIC) | Founding member | Founding member; influential | Trade financing via IsDB possible |
| United Nations & UNCTAD | Both active members | Both active | Multilateral coordination platform |
| G77 & South-South Cooperation | Both founding members | Both founding members | Shared developing-country agenda |
| African Union | Observer interest | Full member, pivotal | Potential AU platform for engagement |
| WTO | Full member | Full member | Trade dispute/cooperation legal framework |
Current Engagement Characteristics:
- Diplomatic: Active embassy-to-embassy cooperation with regular consultations
- Commercial: Growing bilateral trade focused on textiles, pharmaceuticals, and food products
- Educational: Egyptian universities attract Bangladeshi students (Al-Azhar especially significant for Islamic studies)
- Religious: Al-Azhar University and Egyptian religious institutions maintain strong links with Bangladesh’s Islamic institutions[12]
Source: Embassy of Egypt in Dhaka Official Website | Ministry of Foreign Affairs of Bangladesh Bilateral Relations Database | Organisation of Islamic Cooperation Member Directory
7. BANGLADESH-EGYPT BILATERAL TRADE ANALYSIS: THE COUNTRY PROFILE ECONOMIC CORRIDOR
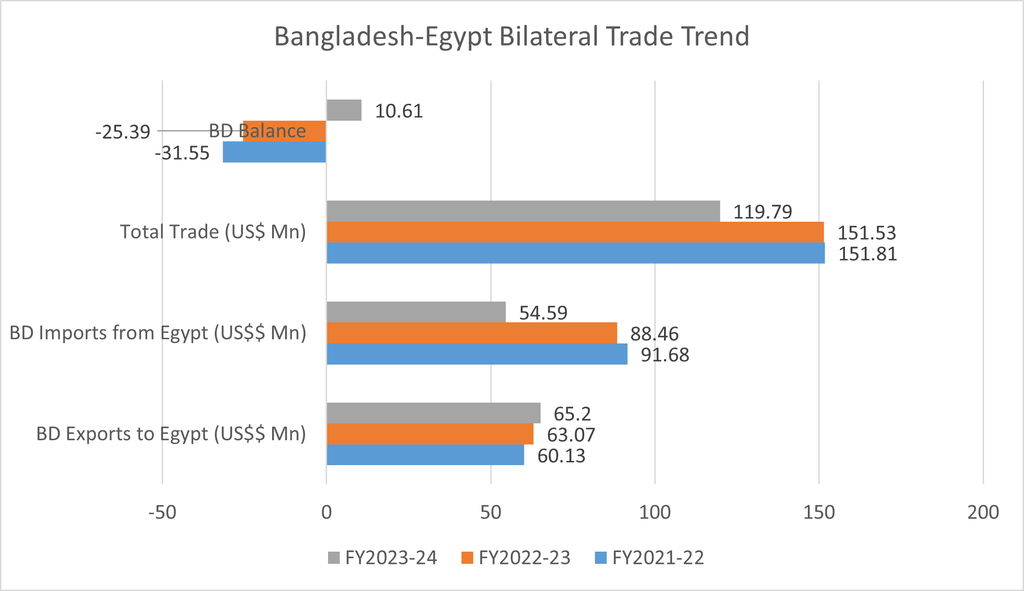
Bilateral Trade Overview (Recent Years)
| Fiscal Year | BD Exports to Egypt (US$$ Mn) | BD Imports from Egypt (US$$ Mn) | Total Trade (US$ Mn) | BD Trade Surplus | Source |
|---|---|---|---|---|---|
| FY2021-22 | 60.13 | 91.68 | 151.81 | -31.55 | EPB/DGCI&S |
| FY2022-23 | 63.07 | 88.46 | 151.53 | -25.39 | EPB |
| FY2023-24 | 65.20 | 54.59 | 119.79 | +10.61 | EPB/BBS |
| CY2024 (Est) | ~70-75 | ~55-60 | ~125-135 | +10-15 | Calculated |
Current Bilateral Trade Characteristics:
- Trade Deficit → Surplus Shift: Bangladesh recorded its first bilateral trade surplus (+US$10.61 Mn) in FY2023-24 after years of deficit, as Egyptian imports declined (currency pressure) while Bangladesh exports grew
- Magnitude: ~US$120-135 million total bilateral trade — well below potential given both economies’ size
- Product Complementarity: Bangladesh exports apparel/textiles/pharma; Egypt exports fertilizers, raw cotton, chemicals, food products
- Growth Potential: Trade relations hold significant unrealized growth potential — some estimates suggest US$500+ million possible with strategic engagement
What Bangladesh Exports to Egypt (Top Products)
| Product Category | Estimated Value (US$ Mn) | % of BD Exports to Egypt | HS Code | End Use in Egypt |
|---|---|---|---|---|
| Apparel, Knitted/Crocheted | ~38-42 | 58-60% | HS61 | Retail clothing market |
| Apparel, Woven | ~15-18 | 23-25% | HS62 | Retail clothing market |
| Pharmaceuticals | ~5-7 | 8-10% | HS30 | Healthcare/pharmacy sector |
| Jute Products & Textiles | ~3-4 | 4-5% | HS53 | Packaging, agricultural uses |
| Leather & Leather Products | ~1-2 | 2-3% | HS41-43 | Footwear, accessories |
| Other Products | ~2-3 | 3-5% | Mixed | Various sectors |
Key Export Insights:
- Apparel Dominance: ~80-85% of Bangladesh’s exports to Egypt are RMG products — reflecting core competitive advantage
- Pharmaceutical Niche: Growing foothold in higher-value generics sector
- Jute Appeal: Egypt’s agricultural and packaging industries purchase Bangladeshi jute — sustainability-oriented demand
What Egypt Exports to Bangladesh (Top Products)
| Product Category | Estimated Value (US$ Mn) | % of Egypt’s Exports to BD | Origin/Use in Bangladesh |
|---|---|---|---|
| Fertilizers & Chemicals | ~25-30 | 45-50% | Agricultural fertilizer input |
| Raw Cotton | ~10-12 | 15-20% | Textile manufacturing input |
| Petroleum & Chemical Products | ~8-10 | 13-15% | Industrial input |
| Plastic Materials | ~4-6 | 7-9% | Manufacturing/packaging |
| Fruits & Vegetables | ~2-3 | 3-5% | Retail consumer market |
| Other Products | ~3-5 | 5-8% | Various sectors |
Egypt’s Export Strategy to Bangladesh:
- Fertilizer-Food Security Link: Egypt leverages phosphate reserves to export fertilizers supporting Bangladesh’s agricultural sector
- Raw Cotton Input: Supplies cotton fiber input to Bangladesh’s textile manufacturing base
- Niche Chemical Exports: Petroleum derivatives and basic chemicals complementary to Bangladesh’s needs
Trade Analysis Key Findings:
- Complementary Economies: Egypt’s agricultural/chemical exports align with Bangladesh’s farming and industrial input needs; Bangladesh’s labor-intensive apparel/pharma align with Egypt’s consumer market
- Unrealized Potential: Current trade is <1% of Egypt’s total trade — massive expansion opportunity
- Currency Dynamics: EGP depreciation has reduced Egyptian imports while making Egyptian exports more competitive
- Logistical Logic: Egypt’s Red Sea/Suez Canal ports provide strategic alternative shipping routes for Bangladeshi exports to Europe/Africa[13]
Source: Bangladesh Export Promotion Bureau Bilateral Trade Statistics 2024 | Egyptian General Organization for Export and Import Control | Bangladesh Bank Trade Data
8. TRADE AND INVESTMENT OPPORTUNITIES WITHIN THE EGYPT COUNTRY PROFILE FRAMEWORK
For Bangladeshi Exporters and Entrepreneurs
Primary Sectors with High Growth Potential:
| Sector | Bangladeshi Competitive Edge | Egyptian Market Need | Estimated Annual Potential |
|---|---|---|---|
| Ready-Made Garments | World’s 2nd largest RMG exporter; cost advantage | 100+ million consumer market; apparel import demand | US$100-200 Mn within 3-5 years |
| Pharmaceuticals | WHO-GMP certified; affordable generics | High pharma import bill (US$3.9 Bn); universal health coverage expansion | US$30-50 Mn within 3 years |
| Jute & Eco-Products | World’s largest jute producer; sustainability edge | Agricultural/packaging demand; EU-linked sustainability pressures | US$10-20 Mn within 3 years |
| Leather & Footwear | 3rd largest leather processor globally | Footwear/leather goods imports; growing middle class | US$10-20 Mn within 3 years |
| Food Processing | Established halal food sector | Large food import dependence; halal consumer preference | US$10-15 Mn within 3 years |
Market Entry Strategy for Egypt:
- Direct Distribution: Partner with Egyptian importers in Cairo/Port Said Free Zones
- QIZ Utilization: Explore Qualifying Industrial Zone status for US-bound re-export through Egypt
- Trade Fair Participation: Engage at Cairo International Fair and sector-specific expos
- Digital Commerce: Leverage Egypt’s growing e-commerce platforms
- Regional Hub: Use Egypt’s 116 million market + access to North/East Africa as regional base[14]
Source: General Authority for Investment (GAFI) Egypt Investment Guide 2025 | Egyptian Exporters Association (EIBA)
For Egyptian Investors and Importers
Why Source from Bangladesh:
| Product Category | Bangladeshi Advantage | Egypt Import Substitution Potential |
|---|---|---|
| Apparel/Textiles | 30-40% cost advantage vs Chinese/regional alternatives | Current imports from China/Turkey relatively expensive |
| Pharmaceuticals | 25-35% cheaper than European generics | Healthcare cost pressures demand affordable alternatives |
| Jute Products | Unmatched scale and quality | Eco-friendly packaging alternatives to plastics |
| Processed Foods | Halal-certified at competitive rates | Large Muslim consumer market |
| Leather Goods | 25-35% cost advantage; quality improving | Leather processing input opportunities |
Strategic Sourcing Rationale:
- Market Access: Bangladesh offers preferential duty via South Asian and developing country arrangements
- Quality Standards: Bangladeshi goods meet ISO, OEKO-TEX, WHO-GMP international standards
- Cost Reduction: Significant savings across multiple import categories
- Complementary Strengths: Egyptian cotton + Bangladeshi manufacturing expertise = potential joint ventures
- Diversification: Reduce dependence on traditional suppliers (China, Turkey, Europe)
9. INVESTMENT LANDSCAPE AND BUSINESS ENVIRONMENT IN THE EGYPT COUNTRY PROFILE
Egypt Investment Climate Assessment
| Investment Aspect | Status | Detail | Bangladesh Relevance |
|---|---|---|---|
| Investment Framework | Strong legal base | Investment Law 72/2017; unified GAFI regulator | Predictable rules for investors |
| Special Economic Zones | Extensive | 10+ Free Zones; Suez Canal Economic Zone (SCZone) | Preferred investment locations |
| Investment Incentives | Competitive | 30-50% tax discounts; free zone exemptions | Attractive for manufacturing |
| Infrastructure Quality | Improving rapidly | New roads, ports, airports, new cities | Reduces logistics costs |
| Energy Availability | Strategic advantage | Natural gas surplus; competitive tariff | Power-intensive industries feasible |
| Labor Market Access | Large workforce | 25+ million workers; competitive wages | Labor-cost advantage possible |
| Market Scale | Massive | 116 million domestic consumers | Direct market + regional hub |
| Legal Protections | Solid | Foreign investment protection; arbitration | Security for investors |
| Currency Stability | Recovering | EGP stabilized after 2024 float | Reduces exchange risk |
| Bureaucracy | Improving | Digitalization of services | Lower transaction costs |
Key Investment Zones for Bangladeshi Businesses
| Zone | Location | Key Industries | Incentives | Strategic Value |
|---|---|---|---|---|
| Suez Canal Economic Zone (SCZone) | Red Sea/Suez | Textiles, manufacturing, logistics | 100% foreign ownership; tax exemptions | Gateway to Africa/Middle East |
| Port Said Free Zone | Mediterranean | Trade, logistics, light manufacturing | Duty exemption; simplified procedures | Access to Mediterranean shipping |
| Tenth of Ramadan City | Cairo corridor | Textiles, food processing, engineering | Industrial city incentives | Proximity to Cairo market |
| 6th October City | West Cairo | Pharmaceuticals, electronics, textiles | Industrial zoning benefits | Metro access; skilled labor |
| New Administrative Capital Zone | East Cairo | Financial services, corporate HQ | New infrastructure incentives | Modern governance hub |
Key Opportunity Insight: The Egypt country profile offers the rare combination of large domestic market (116 million) + strategic location + competitive labor + improving infrastructure — making it a genuine investment destination rather than merely a trading partner[15].
Source: GAFI Egypt Investment Climate Report 2025 | Suez Canal Economic Zone Authority | General Authority for Supply Commodities
10. CHALLENGES AND RISKS IN THE EGYPT COUNTRY PROFILE ASSESSMENT
While the Egypt country profile presents significant opportunities, potential investors must acknowledge the structural challenges requiring mitigation:
Investment Challenge Matrix
| Challenge | Severity | Impact on Bangladeshi Business | Mitigation Strategy |
|---|---|---|---|
| Currency Volatility (EGP) | Moderate-High | Exchange rate uncertainty → reduced margins | Currency hedging; forward contracts; dollar-denominated contracts |
| High Inflation | Moderate | Rising local costs; eroding consumer purchasing power | Price indexation; cost-management; import timing strategy |
| Bureaucratic Complexity | Moderate | Slow approvals; hidden costs | Engage with GAFI; use free zones; partner with local firms |
| Energy Subsidy Reduction | Moderate | Higher utility input costs for manufacturers | Energy-efficient processes; renewable integration |
| Political/Geopolitical Tensions | Moderate | Regional instability (Gaza, Red Sea security) affects confidence | Diversification; risk insurance; flexible logistics |
| Skilled Labor Gaps | Moderate | Limited specialized technical talent | Training programs; talent development partnerships |
| Intellectual Property Enforcement | Moderate | Counterfeit risks for brands | IP registration; proactive enforcement; brand protection |
| Market Competition | High | Established Chinese, Turkish, European suppliers | Niche focus; cost competitiveness; quality differentiation |
Strategic Risk Mitigation for Bangladesh Businesses
- Free Zone Preference: Prioritize investment in SCZone and Port Said Free Zone for protections and incentives
- Currency Hedging: Use forward contracts and maintain USD-denominated pricing where possible
- Local Partnerships: Engage Egyptian partners for market access and regulatory navigation
- Diversification: Spread investment across multiple product categories and regions
- Insurance Coverage: Utilize government investment guarantees and political risk insurance
- Phased Entry: Test markets with exports before committing to direct investment
- Regional Diversification: Use Egypt as one pillar of broader Middle East/Africa strategy
Country Risk Assessment Summary
| Risk Dimension | Rating | Assessment |
|---|---|---|
| Political Risk | Moderate | Stable government; regional tensions warrant monitoring |
| Economic Risk | Moderate-High | IMF program stabilizing; but fiscal pressures persist |
| Currency Risk | Moderate | EGP stabilized; ongoing monitoring essential |
| Operational Risk | Moderate | Bureaucracy improving; free zones offer relief |
| Social Risk | Low-Moderate | Young population; strong work ethic; social stability |
| Security Risk | Low-Moderate | Core economic zones secure; northern Sinai sensitive |
11. STRATEGIC RECOMMENDATIONS FROM THE EGYPT COUNTRY PROFILE
For the Bangladeshi Government
| Priority | Action | Expected Outcome |
|---|---|---|
| Trade Agreement Negotiation | Pursue preferential trade agreement between Bangladesh & Egypt | Tariff reductions; trade facilitation |
| Chamber-to-Chamber Linkage | Formalize FBCCI-Cairo Egyptian Chamber partnership | Business matchmaking; information exchange |
| Consular/Cultural Enhancement | Strengthen embassy-to-embassy commercial sections | Improved visa processing; trade facilitation |
| OIC & IsDB Engagement | Leverage Islamic Development Bank trade financing | Trade credit; investment support |
| Logistics/Shipping Links | Establish direct Bangladesh-Egypt shipping routes | Reduced transit time/cost |
| Skills Exchange Program | Develop technical/vocational exchange with Egypt | Workforce development; mutual benefit |
For Bangladeshi Businesses
| Priority | Action | Expected Outcome |
|---|---|---|
| Market Research Investment | Commission detailed Egyptian market intelligence | Informed market entry decisions |
| Trade Fair Participation | Attend Cairo International Fair 2026 | Business relationships; market visibility |
| Distributor Selection | Identify reliable Egyptian import partners | Established sales channels |
| Product Certification | Secure Egyptian standard certifications | Market access compliance |
| Joint Venture Exploration | Seek Egyptian JV partners in textiles/pharma | Combined strengths; shared risk |
| Logistics Optimization | Optimize shipping routes via Suez/Red Sea corridor | Cost-efficient delivery |
For Egyptian Importers and Investors
| Priority | Action | Expected Outcome |
|---|---|---|
| Supplier Diversification | Source Bangladeshi apparel, pharma, jute | Cost reduction; supply chain resilience |
| Joint Manufacturing | Partner with Bangladeshi textile/pharma firms | Tech transfer; local production |
| Trade Delegation to Dhaka | Visit Bangladesh’s garment/leather hubs | Direct supplier relationships |
| Halal Food Imports | Import Bangladeshi halal-processed foods | Market differentiation; religious compliance |
| Cotton-Textile Partnership | Egyptian cotton + Bangladeshi manufacturing | Value-added product development |
Short-Term Action Plan (0-12 months)
- Formal Institution-to-Institution Engagement: Establish formal working relationship between FBCCI and Egyptian Chambers of Commerce
- Bilateral Trade Mission: Organize business delegation to Cairo in 2026
- Trade Data Transparency: Improve bilateral trade data collection and sharing
- Visa Facilitation: Streamline business visa processes for both directions
- Logistics Linkage: Engage shipping companies for direct route establishment
Long-Term Vision (2-5 years)
- US$500 Million Bilateral Trade Target: Realistic growth from current ~US$130 million base
- Joint Industrial Zones: Explore dedicated Bangladesh industrial zone in SCZone
- Supply Chain Integration: Egyptian cotton + Bangladeshi RMG + combined export to EU/US
- Regional Hub Strategy: Egypt as gateway for Bangladeshi goods to North Africa/Middle East/Europe
- Educational/Technical Cooperation: Exchange programs in engineering, IT/BPO, and technical education
REFERENCES
- CIA World Factbook: Egypt
https://www.cia.gov/the-world-factbook/countries/egypt/ - CAPMAS Central Agency for Public Mobilization and Statistics
https://www.capmas.gov.eg - Egyptian State Information Service (SIS)
https://www.sis.gov.eg - Egyptian Ministry of Planning and Economic Development
https://mped.gov.eg - International Monetary Fund (IMF) Article IV Consultation Egypt
https://www.imf.org/en/Countries/EGY - Central Bank of Egypt
https://www.cbe.org.eg - S&P Global Ratings — Egypt Sovereign Rating
https://www.spglobal.com - Egyptian Ministry of Trade and Industry
https://www.mti.gov.eg - General Authority for Investment and Free Zones (GAFI)
https://www.gafi.gov.eg - Egyptian Ministry of Education and Technical Education
https://moe.gov.eg - Egyptian Ministry of Health and Population
https://www.mohp.gov.eg - Embassy of Egypt in Dhaka / Ministry of Foreign Affairs of Bangladesh
https://www.mofa.gov.bd - Bangladesh Export Promotion Bureau (EPB)
https://www.epb.gov.bd - Egyptian Exporters Association (EIBA) / GAFI Investment Guide
https://www.gafi.gov.eg - Suez Canal Economic Zone Authority
https://www.sczone.eg
For more reports, please contact us