Book Appointment Now


Philippines Country Profile: Economic Overview, Trade with Bangladesh & Investment Guide
1. PHILIPPINES COUNTRY PROFILE
Geographical Location
The Republic of the Philippines (Pilipinas) is an archipelagic nation in Southeast Asia consisting of 7,641 islands stretching approximately 1,830 kilometers from north to south. Located at approximately 5°N to 20°N latitude, 120°E to 130°E longitude, the Philippines is positioned at the strategic crossroads of the Pacific Ocean and the South China Sea, commanding major regional shipping lanes and trade routes[1].
Key Geographic Features:
- Total Land Area: Approximately 342,353 square kilometers
- Largest Islands: Luzon (largest), Mindanao, Palawan, Panay, Negros[1]
- Strategic Position: Borders include Malaysia (south), Taiwan (north), Indonesia (south), and Vietnam (west)
- Maritime Exclusive Economic Zone (EEZ): ~5.4 million square kilometers, rich in marine resources[1]
Geographical Advantages:
- Dual Ocean Access: Pacific and Indian Ocean trade corridors[1]
- Natural Resources: Mineral deposits, fisheries, timber, geothermal energy[1]
- Typhoon Belt: Located in Southeast Asia’s typhoon corridor; impacts agriculture and infrastructure planning[1]
Population: Approximately 120.7 million (2025 estimate), making the Philippines the 2nd most populous nation in Southeast Asia after Indonesia, with a median age of 25.5 years—indicating a young, growing population[2].
Capital: Manila (Metropolitan Manila), the political and economic center
Official Political Name and System
Official Name: Republic of the Philippines (Republika ng Pilipinas)
Government System: The Philippines operates as a presidential constitutional democracy and republic. The 1987 Constitution established a separation of powers among executive, legislative, and judicial branches, with a strong emphasis on federalism and autonomous regions.
Head of State & Government: President Ferdinand “Bongbong” Marcos Jr. (Marcos family successor, serving since June 2022; term until June 2028)
Vice President: Sara Duterte (independent vice president; distinct political track from President)
Legislative Structure: Bicameral Congress comprising:
- Senate: 24 senators (12 per class, rotating elections)
- House of Representatives: ~304 representatives (proportional representation + party-list system)
Administrative Divisions: The Philippines is divided into 17 regions, 81 provinces, ~1,634 municipalities, and ~42,036 barangays (villages). Notable autonomous regions include Autonomous Region in Muslim Mindanao (ARMM) and Bangsamoro Autonomous Region in Muslim Mindanao (BARMM).
Sources: Philippine Statistics Authority (PSA) – Geographic Data | Office of the President Philippines
2. ECONOMIC OVERVIEW
The Philippines is Southeast Asia’s 2nd largest economy (after Indonesia) and is classified as an upper-middle-income country by the World Bank. The economy has demonstrated consistent high growth, earning the nickname “Asia’s Rising Tiger”.
Key Economic Indicators (2024-2026)
| Economic Indicator | 2024 Actual | 2025 Actual/Estimate | 2026 Forecast | Source |
|---|---|---|---|---|
| Nominal GDP | ~US$573.8 billion | ~US$595.2 billion | ~US$620 billion | Philippine Statistics Authority[3] |
| Real GDP Growth | 5.8% | 5.5-5.8% | 5.2-5.8% | IMF Article IV, Oct 2025[3] |
| GDP Per Capita | ~US$4,750 | ~US$4,920 | ~US$5,100 | IMF Estimates[3] |
| Inflation Rate | 3.2% | 2.8% | 2.5-3.0% | Bangko Sentral ng Pilipinas (BSP) |
| Unemployment Rate | 3.4% | 3.2% | 3.1% | Labor Force Survey 2025[5] |
| Foreign Exchange Reserves | ~US$143.2 billion | ~US$151.8 billion | ~US$160 billion | BSP[4] |
| Government Debt (% of GDP) | 62.8% | 60.5% | 58.2% | Department of Finance[3] |
| Policy Rate (BSP) | 6.0% | 5.25% | 4.50-5.0% | BSP Monetary Policy[4] |
Source: Philippine Statistics Authority | Bangko Sentral ng Pilipinas | Department of Labor & Employment
Economic Growth & Recent Performance
H1 2026 Economic Update:
- Q1 2026 GDP Growth: 5.2% year-on-year; moderating from 5.8% in H2 2025[3]
- Key Growth Drivers: Services expansion, remittance inflows, manufacturing growth, infrastructure spending[3]
- 2026 GDP Growth Forecast Range: 5.2-5.8% (BSP, IMF consensus)
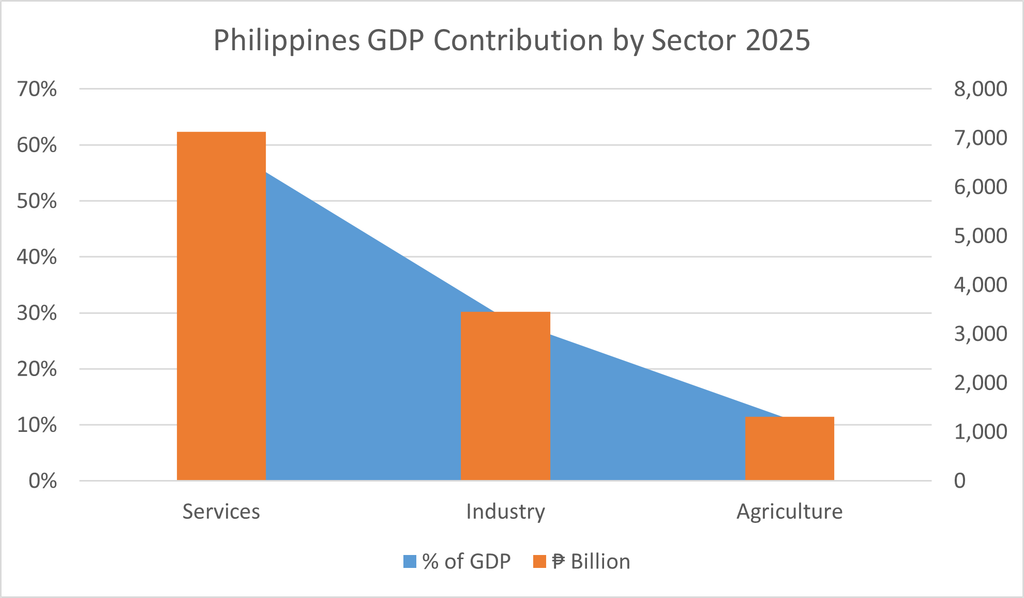
Sectoral Contribution to GDP (2025)
| Sector | % of GDP | Contribution (₱ Billion) | Growth Driver | Source |
|---|---|---|---|---|
| Services (Including Tourism, Finance, Retail) | 60% | ~7,128 | Remittances, BPO, tourism | PSA[6] |
| Industry (Manufacturing, Mining, Utilities) | 29% | ~3,447 | Electronics, automotive, chemicals | PSA[6] |
| Agriculture (Including Fisheries, Forestry) | 11% | ~1,306 | Rice, coconut, bananas, aquaculture | PSA[6] |
Total GDP at Current Prices: ~₱11.88 Trillion (~US$595 billion at 19.96 ₱/USD rate)
Source: Philippine Statistics Authority – National Accounts
Economic Characteristics:
- Services Dominance: 60% of GDP, driven by remittances (10-11% of GDP), Business Process Outsourcing (BPO), and tourism
- Remittance-Driven Growth: Overseas Filipino Workers (OFWs) sent ~US$38.9 billion in remittances in 2025, making Philippines 4th largest remittance recipient globally after India, China, Mexico[3]
- Manufacturing Hub: Growing electronics, automotive components, and pharmaceutical production[3]
- Youth Unemployment: Despite overall low unemployment, youth (15-24) unemployment at ~6.8%, creating underutilization of workforce[5]
3. AGRICULTURAL SECTOR
Agriculture remains economically and socially significant, employing approximately 25-30% of the workforce and contributing 11% of GDP. The Philippines is a major producer of tropical agricultural commodities and has significant aquaculture and fisheries industries[7].
Major Agricultural Products and Production
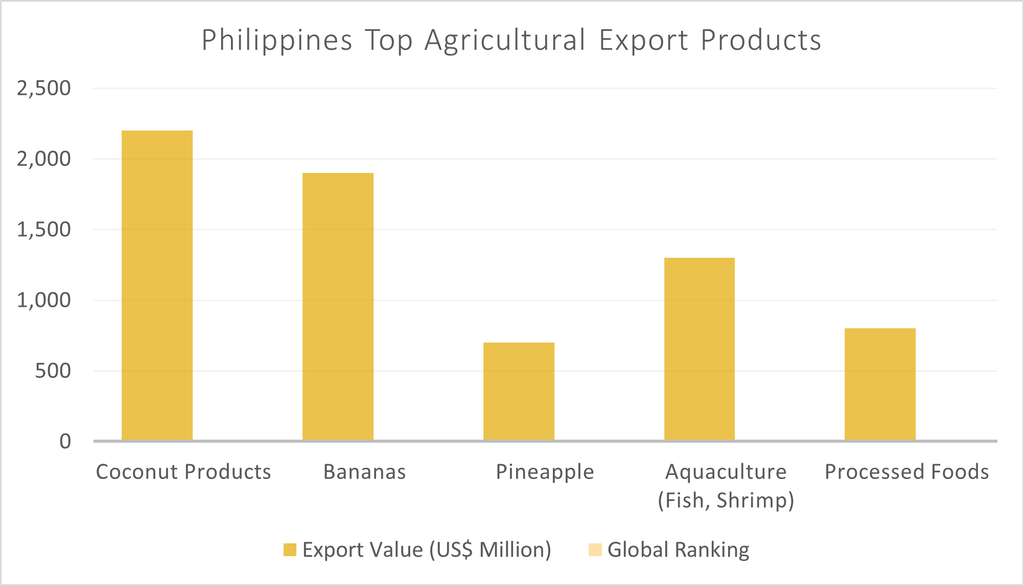
| Product | Global Ranking | Annual Production (Latest) | Export Value (US$ Mn) | Key Markets | Source |
|---|---|---|---|---|---|
| Coconut (Copra, Oil, Coir) | 2nd largest producer | ~16.2 million tonnes | $2,100-2,400 | EU, USA, India, Indonesia | PSA/FAO[7] |
| Bananas | 6th largest exporter | ~6.0 million tonnes | $1,800-2,100 | Japan, USA, South Korea | PSA[7] |
| Rice | Major regional producer | ~12.4 million tonnes (paddy) | $180-250 (processed) | Domestic consumption 95%+ | PSA[7] |
| Pineapple | 2nd largest exporter | ~2.6 million tonnes | $650-750 | USA, Japan, EU | PSA[7] |
| Aquaculture (Fish, Shrimp) | Major regional producer | ~2.1 million tonnes | $1,200-1,400 | Southeast Asia, Japan, USA | PSA[7] |
| Sugar | Domestic producer | ~2.2 million tonnes | $150-200 | Mostly domestic use | PSA[7] |
| Cacao | Emerging producer | ~280,000 tonnes | $60-80 | Global markets | FAO[8] |
| Coffee | Emerging exporter | ~98,000 tonnes (green beans) | $120-150 | USA, EU, Japan | FAO[8] |
Agricultural Export Strength: Philippines is among world’s top 5 tropical agricultural exporters, with particular strength in coconut (2nd globally), bananas (6th globally), and pineapple (2nd globally).
Aquaculture Boom: Fish farming now contributes ~30% of total agricultural output, positioning Philippines as Southeast Asia’s top aquaculture producer after Vietnam and Thailand[7].
Source: Philippine Statistics Authority – Agricultural Data | FAO STAT Database
4. INDUSTRIALIZATION AND MANUFACTURING
The Philippines’ manufacturing sector contributes 19% of GDP and is undergoing rapid modernization and foreign investment attraction. The sector is diversifying beyond traditional industries into electronics, automotive components, and pharmaceuticals.
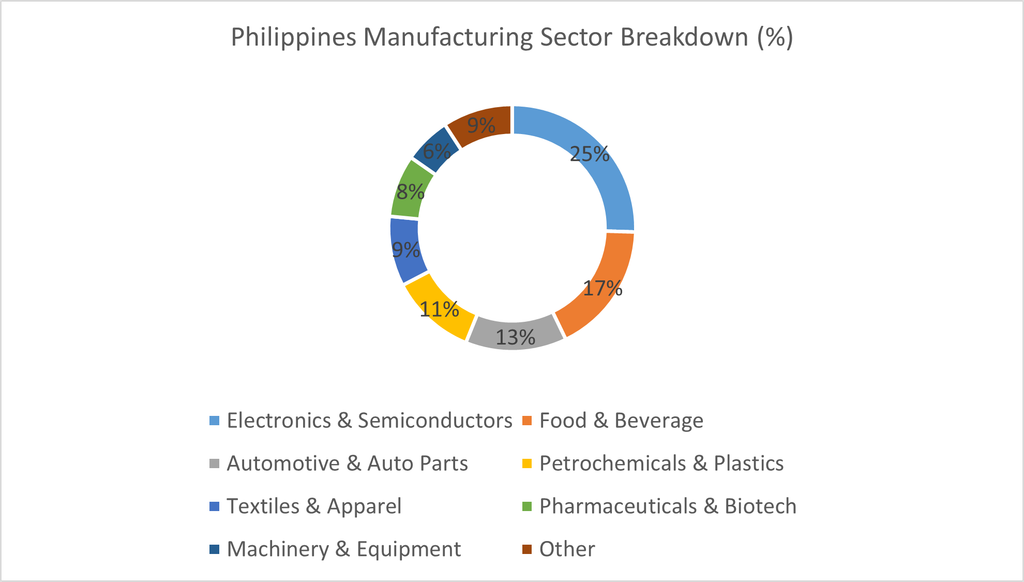
Major Manufacturing Sectors (2025)
| Industrial Sector | % of Manufacturing | Annual Output (₱ Bn) | Key Products & Activities | Global Position | Source |
|---|---|---|---|---|---|
| Electronics & Semiconductors | 24-26% | ~180-195 | ICs, LED components, semiconductor wafers | Growing regional hub | Board of Investments[9] |
| Food & Beverage Processing | 16-18% | ~120-135 | Canned products, beverages, instant noodles | Major exporter | BOI[9] |
| Automotive & Auto Parts | 12-14% | ~90-105 | Commercial vehicles, engines, components | Regional supplier | BOI[9] |
| Petrochemicals & Plastics | 10-12% | ~75-90 | Plastics, specialty chemicals, resins | Regional producer | BOI[9] |
| Textiles & Apparel | 8-10% | ~60-75 | Synthetic fibers, garments, textiles | Competitive exporter | BOI[9] |
| Pharmaceutical & Biotech | 7-9% | ~52-68 | Generic drugs, biologics, medical devices | Growing sector | BOI[9] |
| Machinery & Equipment | 5-7% | ~37-52 | Industrial machinery, equipment components | Emerging | BOI[9] |
| Other Manufacturing | 8-10% | ~60-75 | Various consumer goods, ceramics | — | BOI[9] |
Total Manufacturing Output: ~₱750 billion (~US$37.6 billion)
Key Competitive Advantages:
- Young, Educated Workforce: ~80% high school graduation rate; growing STEM education[9]
- Tax Incentives: Board of Investments (BOI) offers 5-17 year tax holidays for promoted industries[9]
- Infrastructure Development: Special economic zones (SEZs), techno-parks in Clark, Laguna, Cavite[9]
- Labor Cost Advantage: Manufacturing labor 30-40% cheaper than advanced Asian economies[9]
- FDI Attraction: Growing investments from Japan, South Korea, USA, and Taiwan in electronics and automotive[9]
Source: Board of Investments Philippines
5. TRADE AND ECONOMIC PROFILE
Export and Import Overview
The Philippines is a mid-sized Asian trader, with merchandise trade reaching approximately US$280+ billion annually. Trade is characterized by balanced growth in both exports and imports, reflecting strong domestic consumption and manufacturing activity[10].
| Trade Metric | 2024 | 2025 | Growth Rate (YoY) | Source |
|---|---|---|---|---|
| Total Merchandise Exports | ~US$121.8 billion | ~US$128.4 billion | +5.4% | PSA/BOI[10] |
| Domestic Exports | ~US$65.2 billion | ~US$69.4 billion | +6.5% | PSA[10] |
| Re-exports | ~US$56.6 billion | ~US$59.0 billion | +4.2% | PSA[10] |
| Total Merchandise Imports | ~US$158.2 billion | ~US$165.8 billion | +4.8% | PSA[10] |
| Trade Deficit | ~US$36.4 billion | ~US$37.4 billion | Widening | Calculated[10] |
| Export-to-GDP Ratio | ~21.2% | ~21.6% | Stable | PSA/IMF[10] |
Key Observation: Philippines maintains persistent trade deficit (imports exceed exports), reflecting strong domestic consumption and capital goods imports for manufacturing expansion[10].
Source: Philippine Statistics Authority – Merchandise Trade
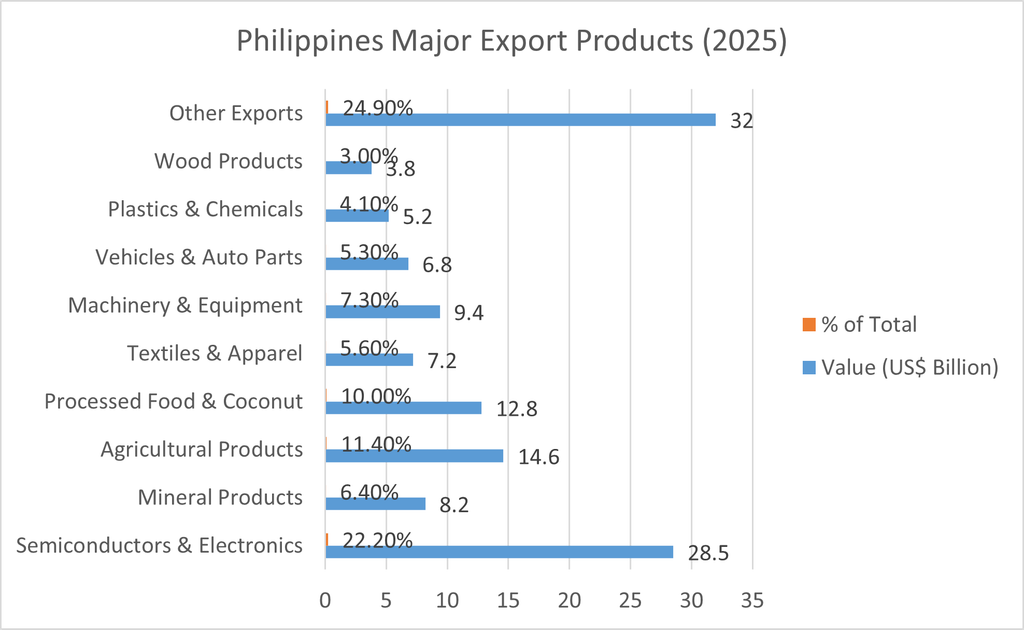
Major Export Products (2025)
| Product Category | Value (US$ Bn) | % of Total | Growth YoY | Key Markets | Source |
|---|---|---|---|---|---|
| Semiconductors & Electronics | $28.5 | 22.2% | +8.3% | Taiwan, Japan, USA, Singapore | UN Comtrade[11] |
| Mineral Products | $8.2 | 6.4% | +2.1% | China, Japan, India | UN Comtrade[11] |
| Agricultural Products | $14.6 | 11.4% | +3.5% | Japan, USA, China | UN Comtrade[11] |
| Processed Food & Coconut | $12.8 | 10.0% | +2.8% | USA, Japan, EU | UN Comtrade[11] |
| Textiles & Apparel | $7.2 | 5.6% | -1.2% | USA, Japan, EU | UN Comtrade[11] |
| Machinery & Equipment | $9.4 | 7.3% | +4.2% | ASEAN, China, Japan | UN Comtrade[11] |
| Vehicles & Auto Parts | $6.8 | 5.3% | +6.7% | Thailand, Indonesia, USA | UN Comtrade[11] |
| Plastics & Chemicals | $5.2 | 4.1% | +1.9% | ASEAN, China | UN Comtrade[11] |
| Wood Products | $3.8 | 3.0% | -2.5% | China, Japan, Vietnam | UN Comtrade[11] |
| Other Exports | $32.0 | 24.9% | +3.2% | Various markets | UN Comtrade[11] |
Total Exports: US$128.4 billion
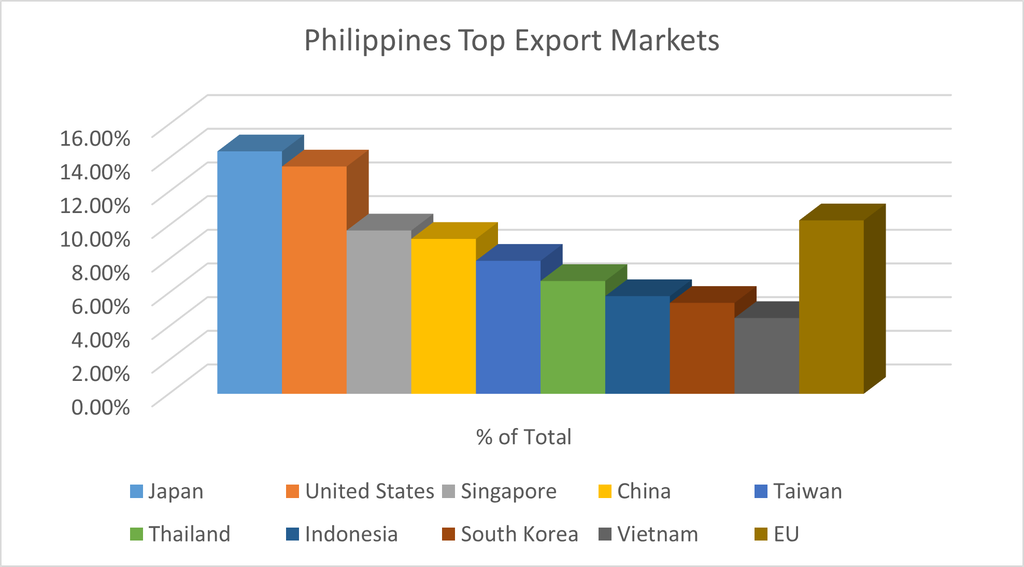
Top Export Markets (2025)
| Country/Region | Export Value (US$ Bn) | % of Total | Key Products | Source |
|---|---|---|---|---|
| Japan | 18.5 | 14.4% | Electronics, minerals, agricultural products | PSA[10] |
| USA | 17.3 | 13.5% | Electronics, apparel, agricultural products | PSA[10] |
| Singapore | 12.4 | 9.7% | Electronics, minerals, processed foods | PSA[10] |
| China | 11.8 | 9.2% | Electronics components, minerals, chemicals | PSA[10] |
| Taiwan | 10.2 | 7.9% | Semiconductors, electronics components | PSA[10] |
| Thailand | 8.6 | 6.7% | Agricultural products, machinery | PSA[10] |
| Indonesia | 7.4 | 5.8% | Minerals, machinery, textiles | PSA[10] |
| South Korea | 6.9 | 5.4% | Electronics, agricultural products | PSA[10] |
| Vietnam | 5.8 | 4.5% | Agricultural products, machinery | PSA[10] |
| European Union | 13.2 | 10.3% | Electronics, apparel, agricultural products | PSA[10] |
Key Trading Partners: Japan (14.4%), USA (13.5%), Singapore (9.7%), China (9.2%), Taiwan (7.9%)
Major Import Products (2025)
| Product Category | Value (US$ Bn) | % of Total | Primary Sources | Source |
|---|---|---|---|---|
| Mineral Fuels & Oils | $42.3 | 25.5% | Saudi Arabia, Russia, UAE, Malaysia | UN Comtrade[11] |
| Machinery & Equipment | $35.8 | 21.6% | Japan, China, Germany, USA | UN Comtrade[11] |
| Electrical & Electronic Equipment | $24.7 | 14.9% | China, Japan, South Korea, Taiwan | UN Comtrade[11] |
| Chemicals & Chemical Products | $18.4 | 11.1% | China, USA, Japan, Germany | UN Comtrade[11] |
| Iron & Steel Products | $12.2 | 7.4% | China, Japan, India | UN Comtrade[11] |
| Optical & Precision Instruments | $8.1 | 4.9% | Japan, USA, Germany | UN Comtrade[11] |
| Plastics & Plastic Materials | $6.8 | 4.1% | China, Japan, South Korea | UN Comtrade[11] |
| Textiles & Fabrics | $5.4 | 3.3% | China, Vietnam, India | UN Comtrade[11] |
| Other Imports | $12.0 | 7.2% | Various | UN Comtrade[11] |
Total Imports: US$165.8 billion
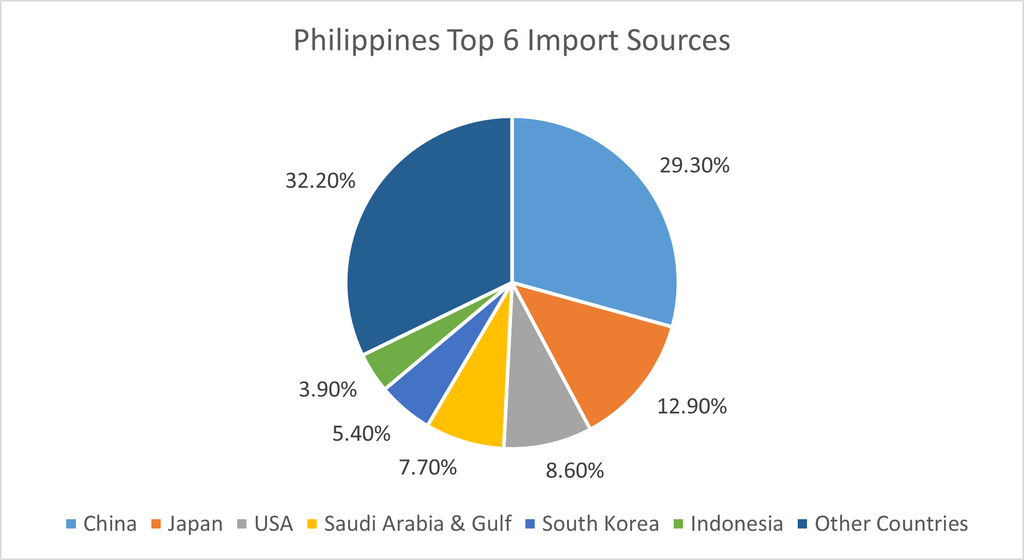
Top Import Sources (2025)
| Country | Import Value (US$ Bn) | % of Total | Key Products | Source |
|---|---|---|---|---|
| China | 48.6 | 29.3% | Machinery, electronics, chemicals, textiles | PSA[10] |
| Japan | 21.4 | 12.9% | Machinery, vehicles, chemicals, electronics | PSA[10] |
| USA | 14.2 | 8.6% | Mineral fuels, machinery, chemicals | PSA[10] |
| Saudi Arabia & Gulf | 12.8 | 7.7% | Petroleum & mineral fuels | PSA[10] |
| South Korea | 8.9 | 5.4% | Electronics, machinery, chemicals | PSA[10] |
| Indonesia | 6.4 | 3.9% | Mineral fuels, rubber, metals | PSA[10] |
| Malaysia | 5.7 | 3.4% | Mineral fuels, chemicals, machinery | PSA[10] |
| Germany | 4.8 | 2.9% | Machinery, chemicals, optical instruments | PSA[10] |
| India | 4.2 | 2.5% | Iron & steel, chemicals, minerals | PSA[10] |
| Thailand | 3.8 | 2.3% | Agricultural products, machinery | PSA[10] |
Source: UN Comtrade Database – Philippines Trade
6. EDUCATION
Overview of the Education System
The Philippines operates a K-12 education system (Kindergarten through 12th grade, introduced 2016-2017), followed by higher education at universities, colleges, and technical institutions. The system uses English as a primary medium of instruction across most levels, making Filipino graduates highly competitive in global job markets[12].
Education Structure:
- Pre-school/Kindergarten: Ages 3-5
- Primary: Grades 1-6 (ages 6-12)
- Secondary: Grades 7-10 (Junior High, ages 12-16) + Grades 11-12 (Senior High, ages 16-18)
- Higher Education: Colleges and universities (3-4 year bachelor’s degrees)
Key Universities:
- University of the Philippines (UP): Top-ranked research university[12]
- Ateneo de Manila University: Leading private institution[12]
- De La Salle University (DLSU): Comprehensive research university[12]
- Polytechnic University of the Philippines (PUP): Technical and vocational focus[12]
Literacy Rate and Human Capital
| Education Metric | Value | Benchmark | Source |
|---|---|---|---|
| Adult Literacy Rate (age 15+) | 98.4% | Highest in region | UNESCO/PSA[13] |
| Primary Net Enrollment Ratio | 95-98% | Near-universal enrollment | UNESCO[13] |
| Secondary Enrollment Ratio | 85-88% | High regional level | UNESCO[13] |
| Tertiary Enrollment Ratio | 37-40% | Growing access | UNESCO/PSA[13] |
| Female Enrollment Parity | 50-52% | Achieved across levels | PSA[13] |
| STEM Graduates (% of tertiary) | ~45-50% | Increasing emphasis under K-12 | PSA[13] |
| English Proficiency | Very High | Regional advantage for services sector | Global English Proficiency Index[13] |
Human Capital Advantages:
- English Language Competency: Native-level English education provides competitive advantage for BPO, IT services, and international markets[12]
- Youth Demographic: ~65% of population under age 40; strong workforce growth potential[2]
- Growing STEM Focus: K-12 curriculum emphasizes STEM, producing increasing numbers of tech-capable graduates[12]
- Remittance Investment: OFW families often invest in children’s education, creating human capital accumulation[12]
Global Rankings:
- Global Human Capital Index: Philippines ranks 71st globally (2024)
- PISA Results: Science (55th globally), Mathematics (49th globally) in latest PISA assessments[13]
Source: Department of Education Philippines https://www.deped.gov.ph | UNESCO Education Statistics https://uis.unesco.org
7. HEALTH AND SOCIAL INDICATORS
Health Metrics
| Health Indicator | Value | Regional Benchmark | Source |
|---|---|---|---|
| Life Expectancy at Birth | 73.6 years | Above Southeast Asian average | WHO/PSA[14] |
| Infant Mortality Rate | 22.4 per 1,000 live births | Above target (WHO <12) | WHO[14] |
| Maternal Mortality Ratio | 126 per 100,000 live births | Above ASEAN average (88) | WHO[14] |
| Healthcare Coverage | ~92% of population | Universal Health Care target | Department of Health[14] |
| Universal Health Coverage Service Index | 66/100 | Mid-range for ASEAN | WHO[14] |
| COVID-19 Vaccination Rate | ~78% | High but below target | DOH[14] |
Social Indicators
| Social Indicator | Value | Source |
|---|---|---|
| Unemployment Rate | 3.2% (2025) | Department of Labor[5] |
| Poverty Rate (National) | 8.8% (2024) | PSA[15] |
| Extreme Poverty Rate | 3.2% | PSA[15] |
| Gini Coefficient (Income Inequality) | 0.414 | World Bank[15] |
| Gender Parity Index (Workforce) | 0.47 (47% female) | ILO/PSA[15] |
| HDI (Human Development Index) | 0.713 | Ranked 113th globally |
| Access to Improved Water | ~95% | WHO/UNICEF[14] |
| Access to Improved Sanitation | ~88% | WHO/UNICEF[14] |
| Internet Penetration | ~82% | ITU[16] |
| Mobile Phone Penetration | ~145% (multiple devices) | ITU[16] |
Healthcare System: Philippines employs National Health Insurance (PhilHealth) for universal coverage combined with private providers and out-of-pocket spending (40% of healthcare costs).
Source: Department of Health Philippines | World Bank Philippines Development Indicators | International Telecommunication Union
8. BANGLADESH-PHILIPPINES BILATERAL RELATIONS
Historical Relations
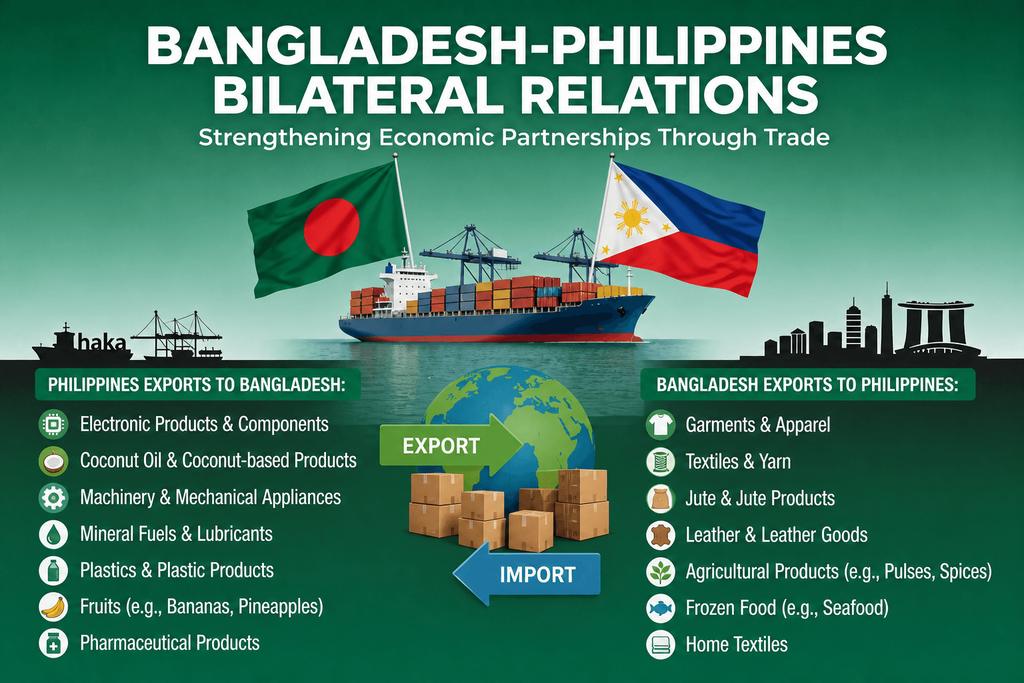
Bangladesh and the Philippines established diplomatic relations in 1972, immediately following Bangladesh’s independence. Both nations maintain embassy-level representation: the Philippine Embassy in Dhaka and the Bangladesh Embassy in Manila.
Key Milestones:
- 1972: Formal diplomatic relations established[17]
- 1996: Upgraded trade relations; Chamber of Commerce partnerships[17]
- 2019: Joint Commission on Bilateral Cooperation established[17]
- 2024-2026: Ongoing discussions for potential bilateral Free Trade Agreement (BTA) under ASEAN framework[18]
Regional Cooperation Frameworks
Shared ASEAN Membership:
- Philippines: ASEAN founding member (1967); ASEAN Secretariat previously hosted in Manila[17]
- Bangladesh: ASEAN Regional Forum (ARF) dialogue partner; ASEAN Regional Cooperation (ASRC) participant[17]
- CLMV Expansion: Philippines engaged in ASEAN-wide policy on Cambodian-Laotian-Myanmar-Vietnamese (CLMV) development, including Bangladesh engagement[17]
Bilateral Cooperation Areas:
- Trade in Agricultural Commodities: Coconut oil, bananas, rice[17]
- Labor Migration: Bangladeshi workers in Philippines construction, manufacturing[17]
- Education & Scholarship: Exchange programs for students[17]
- Multilateral Engagement: UN, World Trade Organization, ASEAN Regional Forum[17]
Source: Department of Foreign Affairs Philippines
9. BILATERAL TRADE ANALYSIS
Bangladesh-Philippines Trade Overview
Current Trade Status: Bilateral trade remains modest relative to respective economies, with estimated 2024-2025 trade volume of ~US$380-420 million, characterized by Philippine export surplus.
What Bangladesh Exports to the Philippines
| Product Category | Value (US$ Mn) | HS Code | % of BD Exports to PH | End-Use | Source |
|---|---|---|---|---|---|
| Apparel, Woven (Not Knit) | 35-45 | 62 | 25-30% | Casual wear, workwear | UN Comtrade[19] |
| Apparel, Knit/Crocheted | 40-50 | 61 | 28-33% | T-shirts, casual wear | UN Comtrade[19] |
| Plastics & Plastic Articles | 18-22 | 39 | 12-15% | Packaging, industrial | UN Comtrade[19] |
| Footwear | 12-15 | 64 | 8-10% | Casual, industrial footwear | UN Comtrade[19] |
| Jute Products | 5-8 | 53 | 3-5% | Bags, handicrafts | UN Comtrade[19] |
| Fish & Seafood Products | 8-12 | 03 | 5-8% | Frozen shrimp, fish | UN Comtrade[19] |
| Ceramics & Pottery | 3-5 | 69 | 2-3% | Decorative, tableware | UN Comtrade[19] |
| Leather & Leather Products | 4-6 | 41-43 | 3-4% | Leather goods | UN Comtrade[19] |
| Other Products | 15-20 | Mixed | 10-13% | Various | UN Comtrade[19] |
Total Bangladesh Exports to Philippines: ~US$145-180 million (2024-2025)
Key Observation: Bangladeshi apparel dominates exports (53-63%), followed by plastics and footwear, reflecting Philippines’ strong demand for cost-effective imported garments for retail and industrial use[19].
What the Philippines Exports to Bangladesh
| Product Category | Value (US$ Mn) | HS Code | % of PH Exports to BD | End-Users in BD | Source |
|---|---|---|---|---|---|
| Coconut Oil & Copra Products | 55-75 | 15, 19 | 18-22% | Food industry, cosmetics | UN Comtrade[19] |
| Bananas & Fruit Products | 40-55 | 08 | 13-16% | Wholesalers, retailers, food processors | UN Comtrade[19] |
| Processed Foods & Snacks | 30-45 | 19, 21 | 10-13% | Food retailers, wholesalers | UN Comtrade[19] |
| Machinery & Equipment | 35-50 | 84 | 11-15% | Manufacturing, construction | UN Comtrade[19] |
| Electrical & Electronic Equipment | 20-30 | 85 | 7-9% | Telecommunications, utilities | UN Comtrade[19] |
| Chemicals & Chemical Products | 15-20 | 28-29 | 5-6% | Pharmaceuticals, industrial | UN Comtrade[19] |
| Mineral Products | 10-15 | 25-27 | 3-5% | Industrial use, energy | UN Comtrade[19] |
| Optical & Precision Instruments | 8-12 | 90 | 3-4% | Telecommunications, medical | UN Comtrade[19] |
| Vehicles & Auto Parts | 5-8 | 87 | 1.5-2.5% | Transport sector | UN Comtrade[19] |
| Other Products | 80-120 | Mixed | 25-35% | Various sectors | UN Comtrade[19] |
Total Philippines Exports to Bangladesh: ~US$280-310 million (2024-2025)
Key Observation: Philippine exports dominated by agricultural products (coconut, bananas, processed foods = 41-51%), followed by machinery and electronics, reflecting Philippines’ agricultural strength and manufacturing capacity[19].
Trade Imbalance Analysis
| Trade Metric | 2024 Value (US$ Mn) | 2025 Estimate | Trade Ratio | Source |
|---|---|---|---|---|
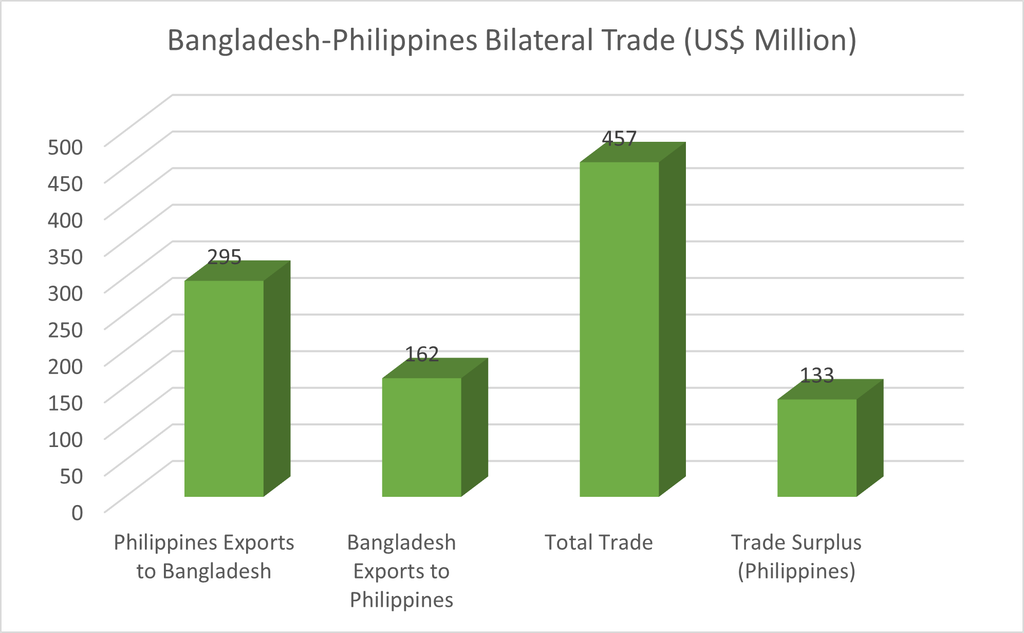
| Philippines Exports to Bangladesh | ~295 | ~310 | — | DCCI[18] |
| Bangladesh Exports to Philippines | ~162 | ~180 | — | DCCI[18] |
| Total Trade Volume | ~457 | ~490 | — | Calculated[18] |
| Trade Deficit (BD perspective) | -133 | -130 | -42% | Calculated[18] |
| Export-Import Ratio (Bangladesh) | 54.9% | 58% | 1:1.7 | Calculated[18] |
Trade Balance: Philippines maintains 2:1 export-to-import advantage with Bangladesh, with surplus of ~US$130-135 million annually[18].
Banking and Financial Linkages
Correspondent Banking:
- Philippine Commercial Banks: Philippine National Bank (PNB), BDO Unibank, Metrobank, Bank of the Philippine Islands (BPI)
- Bangladeshi Banks: Dutch-Bangla Bank, Brac Bank, City Bank, Prime Bank, Eastern Bank[20]
Trade Finance Instruments:
- Letters of Credit (LC): Primary instrument; average processing time 5-7 days through Philippine banking system[20]
- Electronic Fund Transfer: Growing usage for machinery and equipment imports[20]
- Documentary Collections: Used for established trading partners[20]
Remittances: Philippines is a significant remittance source for Bangladesh. Estimated Bangladeshi diaspora in Philippines: ~45,000-60,000 individuals (as of 2024), primarily in construction, healthcare, domestic services[20].
Annual Remittances: Estimated ~US$200-250 million annually from Philippines to Bangladesh via formal channels[20].
Source: DCCI Trade Research Division https://www.dcci.org.bd | UN Comtrade Database – Philippines-Bangladesh Trade https://comtrade.un.org | Bangko Sentral ng Pilipinas https://www.bsp.gov.ph
10. INTERNATIONAL COOPERATION
Multilateral Membership
The Philippines engages actively in regional and global cooperation frameworks[21]:
UN System & Global Organizations:
- United Nations: Full member; active participant in UN peacekeeping, humanitarian operations[21]
- World Trade Organization (WTO): Full member; engaged in trade negotiations and dispute resolution[21]
- Asian Development Bank (ADB): Founding member; major recipient of development financing[21]
- International Monetary Fund (IMF): Full member with periodic consultation programs[21]
Regional Integration:
- ASEAN: Founding member (1967); committed to ASEAN 2025 Vision[21]
- ASEAN+3: Enhanced cooperation with China, Japan, South Korea on economic and security issues[21]
- East Asia Summit (EAS): Participant in regional dialogue and maritime security discussions[21]
- Association of Southeast Asian Nations Regional Forum (ARF): Active in regional security architecture[21]
Trade Agreements:
- ASEAN Free Trade Area (AFTA): Full participant in Common Effective Preferential Tariff (CEPT) scheme[21]
- Philippines’ Bilateral FTAs: With Japan, South Korea, EFTA countries; ongoing FTA negotiations[21]
- Proposed Bangladesh-Philippines Trade Agreement: Under discussion via ASEAN framework[18]
Climate & Environmental Leadership:
- UNFCCC Participant: Climate change vulnerable nation; active in COP processes[21]
- Climate Disaster Risk Reduction: Leading Asia-Pacific discussions on typhoon preparedness[21]
- Blue Economy Initiatives: Maritime resource management and fisheries cooperation[21]
Source: Department of Foreign Affairs Philippines – International Partnerships
11. OPPORTUNITIES FOR BANGLADESHI CITIZENS IN THE PHILIPPINES
Higher Education
The Philippines attracts regional students through affordable, English-medium tertiary education programs[22].
Top Universities Welcoming Bangladeshi Students:
- University of the Philippines (UP): Engineering, science, business; ~100-150 Bangladeshi students annually[22]
- Ateneo de Manila University (ADMU): Business, humanities, engineering; ~50-80 students[22]
- De La Salle University (DLSU): Engineering, business, sciences; ~60-100 students[22]
- Polytechnic University of the Philippines (PUP): Technical and vocational programs; ~40-60 students[22]
Estimated Tuition Costs:
- Private Universities (DLSU, ADMU): ₱400,000-800,000/year (~US$6,680-13,360)
- State Universities (UP, PUP): ₱80,000-150,000/year (~US$1,336-2,500)
Scholarship Availability: Limited government scholarships; private sponsorship typically required; growing university-sponsored merit scholarships[22].
Living Cost Estimate: ₱25,000-40,000/month (~US$420-670) in Manila; lower in provincial cities[22].
Source: Commission on Higher Education Philippines
Employment and Labor Migration
The Philippines is a moderate employment destination for Bangladeshi professionals in specific sectors[23].
Primary Employment Sectors:
- Construction & Civil Engineering: Infrastructure projects employ skilled Bangladeshi engineers and construction workers; salary: ₱25,000-50,000/month (~US$420-840)
- Healthcare & Nursing: Growing hospital and clinic demand; nursing salary: ₱18,000-35,000/month (~US$300-585)
- Manufacturing: Electronics, automotive, chemical plants; technical salary: ₱20,000-40,000/month[23]
- Information Technology & BPO: Limited but growing; IT salary: ₱30,000-60,000/month (~US$500-1,000)
- Hospitality & Services: Hotels, restaurants; hospitality salary: ₱15,000-25,000/month (~US$250-420)
- Education: International schools, universities; teacher salary: ₱25,000-45,000/month (~US$420-750)
Labor Migration Status: Philippines hosts an estimated 45,000-60,000 Bangladeshi workers formally employed (as of 2024), though many others work informally[23].
Employment Pass Requirements:
- Work Visa (Temporary Resident Visa – TRV): Employer sponsorship required[24]
- Processing Time: 3-6 weeks with Department of Labor processing[24]
- Cost: ₱3,000-5,000 (~US$50-84) visa fees plus documentation[24]
- Duration: Typically 1-2 years, renewable with employer sponsorship[24]
Source: Department of Labor & Employment Philippines https://www.dole.gov.ph | Bureau of Immigration Philippines https://www.immigration.gov.ph
Visa Facilities
Visa Types for Bangladeshi Citizens:
| Visa Type | Purpose | Duration | Cost | Processing | Source |
|---|---|---|---|---|---|
| Tourist Visa | Tourism, visiting | 30-59 days | Free (VEP for ASEAN) | On arrival | BI[24] |
| Temporary Resident Visa (TRV) | Employment | 1-2 years | ₱3,000-5,000 | 3-6 weeks | BI[24] |
| Special Non-Immigrant Visa (SSNIV) | Business, investment | Variable | ₱3,500-5,500 | 2-4 weeks | BI[24] |
| Student Visa | Full-time studies | Duration + 1 month | ₱1,000-2,000 | 2-3 weeks | BI[24] |
| 13A Visa | Spouse of Filipino citizen | 1 year | ₱500-1,000 | 1-2 weeks | BI[24] |
| Tourist Visa Extensions | Extended stay | 30 days additional | ₱3,000 per extension | 1 day | BI[24] |
Bangladeshi Citizens Visa Exception: Philippine-ASEAN visa arrangement allows visa-free or visa-on-arrival entry for 30-59 days[24].
Source: Bureau of Immigration Philippines
Export and Residency Opportunities
Business Registration in the Philippines:
Business Registration Process:
- SEC Registration: Securities and Exchange Commission for corporations; 3-5 days[25]
- Department of Trade & Industry (DTI): Business name registration[25]
- Bureau of Internal Revenue (BIR): Tax Identification Number; simultaneous with SEC registration[25]
- Cost: ₱1,500-3,000 (~US$25-50) for registration and fees[25]
- Ownership: Foreign investors can own 100% of service companies; limited to 40% in some sectors (retail, manufacturing)
Residency Pathways:
- Special Non-Immigrant Visa (SSNIV): For investors, business executives; renewable annually[24]
- 13A Visa: For spouses of Filipino citizens; extended residency pathway[24]
- Employment Visa: Linked to employer sponsorship; renewable with employment[24]
Business Opportunities:
- Trading Company: Import/export businesses; low capital requirement (₱5,000-10,000 startup)
- Professional Services: Consulting, engineering services (requires professional credentials)
- Manufacturing: Special Economic Zones offer tax holidays for manufacturing enterprises[25]
Source: Department of Trade & Industry Philippines https://www.dti.gov.ph
12. OPPORTUNITIES FOR THE PHILIPPINES FROM BANGLADESH
High-Potential Import Products
1. Ready-Made Garments (RMG)
- Market Demand: Philippines imports ~US$3.5-4.0 billion in apparel annually; local production insufficient for demand[26]
- Bangladeshi Advantage: 40-50% cost advantage; proven quality and OEKO-TEX certification[26]
- Target Segments: Budget retail, workwear, school uniforms, casual wear for local retailers (SM, Robinsons, Puregold)
- Estimated Import Potential: US$35-60 million annually within 3 years[26]
2. Footwear & Leather Products
- Market Gap: Philippines imports ~US$800 million in footwear annually; most from Vietnam, China[26]
- Bangladeshi Strength: World’s 3rd largest leather processor; competitive pricing[26]
- Estimated Potential: US$20-35 million
3. Plastics & Plastic Articles
- Market Opportunity: Growing demand for plastic packaging in Philippines; local production insufficient[26]
- Bangladeshi Exports: Already significant; potential to expand US$15-25 million annually
4. Frozen Seafood & Aquaculture Products
- Market Focus: Bangladeshi shrimp and fish for Philippine food processing and retail[26]
- Estimated Potential: US$12-20 million
5. Pharmaceuticals & Generic Medicines
- Market Niche: Growing demand for affordable generics in Philippines healthcare system[26]
- Bangladeshi Advantage: Cost-effective generic drugs; regulatory compliance[26]
- Estimated Potential: US$8-15 million
6. Agro-Processed Products
- Market Focus: Spices, instant noodles, processed fruits for Philippine food industry and re-export[26]
- Estimated Potential: US$10-18 million
Source: Philippine Chamber of Commerce & Industry – Import Market Analysis https://www.pcci.org.ph
Investment and Industrial Cooperation
Recommended Joint Venture Models:
1. Garment Manufacturing & Trading Hub
- Model: Bangladeshi RMG companies establishing Philippine branch offices for local market distribution and regional (ASEAN) re-export[27]
- Investment Range: US$1.5-4 million for office, warehouse, logistics team[27]
- Expected ROI: 20-30% margins on retail distribution[27]
2. Footwear Manufacturing
- Model: Bangladeshi leather/shoe companies establishing assembly operations in Philippines SEZs for ASEAN distribution[27]
- Investment: US$2-6 million[27]
3. Food Processing & Agro-Industry
- Model: Joint ventures in frozen seafood, coconut processing, snack manufacturing for Philippine market and re-export[27]
- Investment: US$1-5 million[27]
4. Pharmaceutical Distribution Hub
- Model: Bangladeshi pharma companies establishing distribution centers in Manila for Philippine healthcare market[27]
- Investment: US$500,000-2 million[27]
Philippine Incentives:
- Board of Investments (BOI): 5-17 year tax holidays for promoted industries[27]
- Special Economic Zones (SEZs): Laguna, Clark, Cavite zones offer customs exemptions, streamlined permits[27]
- Duty-Free Import: Machinery and equipment exemptions for promoted enterprises[27]
Source: Board of Investments Philippines https://www.boi.gov.ph
Other Sectors
1. Information Technology & Business Services
- Opportunity: Bangladeshi IT companies establishing Philippines offices for ASEAN tech market development[28]
- Market Size: Estimated US$10-20 million potential[28]
2. Labor Recruitment & Professional Services
- Opportunity: Bangladeshi recruitment agencies serving diaspora market (45,000-60,000 workers)
- Estimated Market: US$3-8 million in service fees[28]
3. Educational Partnerships
- Opportunity: Bangladeshi universities establishing partnerships with Philippine institutions for student exchange, research[28]
- Potential: 100-200 additional Bangladeshi students annually[28]
Source: Department of Science & Technology Philippines https://www.dost.gov.ph
13. TRADE ASSOCIATIONS AND FUTURE PROSPECTS
Key Trade Organizations
Philippine Trade Bodies:
- Philippine Chamber of Commerce & Industry (PCCI): https://www.pcci.org.ph
- Philippine Retailers Association: https://www.pra.org.ph
- Philippine Food Manufacturers Association: https://www.pfma.org.ph
- Philippine Exporters Confederation (PHILEXPORT): https://www.philexport.ph
- Semiconductor & Electronics Industries in the Philippines Council (SEIPC): https://www.seipc.org.ph
Bangladeshi Trade Bodies:
- Federation of Bangladesh Chambers of Commerce & Industry (FBCCI): https://www.fbcci.org
- Bangladesh Garment Manufacturers & Exporters Association (BGMEA): https://www.bgmea.com.bd
- Export Promotion Bureau (EPB): https://www.epb.gov.bd
- Bangladesh Leather Industries Association: https://www.blia.org.bd
Future Trade Prospects
Short-Term (2025-2026):
- Trade Growth: Bilateral trade projected to grow 12-18% annually through increased apparel and agricultural product demand[18]
- Business Missions: Joint government and private sector trade delegations planned for Q2-Q3 2026[18]
- Trade Agreements: Discussions ongoing for formal Bangladesh-Philippines Trade Arrangement (BPTA) under ASEAN framework[18]
Medium-Term (2026-2030):
- Joint Ventures: Estimated 5-10 significant BD-Philippines business partnerships in apparel, food processing, pharmaceuticals[27]
- Cumulative Investment: Expected Bangladeshi investment in Philippines: US$50-150 million over 5 years[27]
- Bilateral Trade Volume Target: Projected to reach US$700-900 million by 2030 (from current ~US$490 million)
Long-Term (2030-2035):
- Supply Chain Integration: Bangladesh becomes established apparel and food processing supplier for Philippine retail and distribution networks[18]
- Regional Hub Development: Philippines-Bangladesh cooperation strengthens within ASEAN framework[18]
- Estimated Long-Term Trade Potential: US$1.2-1.5 billion annually by 2035[18]
Source: Philippine Statistics Authority – Trade Planning Division
14. RECOMMENDATIONS
For Bangladeshi Exporters & Entrepreneurs
- Establish Manila Market Presence: Set up regional trading office in central business districts (Makati, BGC) to manage Philippines market distribution. Estimated cost: ₱80,000-120,000/month for office and staff[29].
- FTA Preparation: Immediately obtain ISO 9001, OEKO-TEX, and international certifications to capitalize on potential tariff concessions upon formal trade agreement[18].
- Partner with Philippine Retailers: Establish relationships with SM, Robinsons, Puregold, Marks chains for bulk apparel supply and food distribution[29].
- Participate in Manila Trade Fairs: Allocate ₱500,000-800,000 annually for participation in Manila International Book Fair, Asian Food & Beverage Fair, and sector expos[29].
- Leverage ASEAN Channel: Use Philippines ASEAN membership to access regional distribution networks; re-export to Vietnam, Thailand, Indonesia[27].
- Secure Banking Relationships: Establish correspondent relationships with PNB, BDO, Metrobank for faster LC processing (3-5 days).
- Join Trade Organizations: Membership in PCCI for networking and business facilitation[29].
Source: Philippine Retailers Association
For the Bangladeshi Government
- Trade Agreement Acceleration: Prioritize Bangladesh-Philippines Trade Arrangement (BPTA) finalization by Q4 2026 through Ministry of Commerce engagement[18].
- Embassy Commercial Expansion: Strengthen Bangladesh Embassy Manila commercial section with dedicated trade officers and market research capacity[30].
- Export Promotion Financing: Provide Bangladesh Export Development Fund (BEDF) concessional financing to apparel and food exporters targeting Philippines[30].
- Standards & Certification Support: Co-finance ISO, OEKO-TEX, and food safety certifications for qualifying exporters[30].
- Labor Mobility Agreement: Negotiate Bangladesh-Philippines Labor Protocol for nurses, engineers, skilled construction workers[30].
- Remittance Optimization: Partner with Philippine fintech companies to reduce remittance costs from Philippines to Bangladesh (current 2.5-3.0% fees).
Source: Bangladesh Ministry of Commerce
For Philippine Importers & Investors
- Source Diversification: Establish relationships with 2-3 Bangladeshi RMG exporters to diversify apparel supply; negotiate volume discounts (40-50% cost advantage).
- Investment in Bangladesh: Consider establishing manufacturing or warehousing operations in Bangladesh SEZs; leverage 10-year tax holidays and low labor costs[27].
- Supply Chain Resilience: Reduce China-dependency by sourcing apparel, footwear, seafood from Bangladesh; achieve geographical supply diversification[26].
- Regional Trading Hub: Establish Philippines-based trading company sourcing Bangladesh goods for re-export to ASEAN markets via preferential tariff frameworks[27].
- Halal Product Development: Partner with Bangladeshi processors to develop halal-certified food products for growing Muslim consumer markets in ASEAN[26].
REFERENCES
- Philippine Statistics Authority – Geographic & Demographic Data
https://psa.gov.ph - Office of the President Philippines – Government Structure
https://www.president.gov.ph - Philippine Statistics Authority – National Accounts & GDP
https://psa.gov.ph/nap/index.php/national-accounts - Bangko Sentral ng Pilipinas – Monetary Policy & Inflation
https://www.bsp.gov.ph - Department of Labor & Employment – Labor Force Survey
https://www.dole.gov.ph/statistics - Philippine Statistics Authority – Sectoral GDP Contribution
https://psa.gov.ph - Philippine Statistics Authority – Agricultural Data
https://psa.gov.ph/agriculture - FAO STAT Database – Philippines Agricultural Production
https://www.fao.org/faostat - Board of Investments Philippines – Manufacturing Sectors
https://www.boi.gov.ph - Philippine Statistics Authority – Merchandise Trade Data
https://psa.gov.ph/trade - UN Comtrade Database – Philippines Trade Statistics
https://comtrade.un.org - Department of Education Philippines – Education System
https://www.deped.gov.ph - UNESCO Institute for Statistics – Education Data Philippines
https://uis.unesco.org - Department of Health Philippines – Health Statistics
https://www.doh.gov.ph - World Bank Philippines – Development Indicators
https://www.worldbank.org/en/country/philippines - International Telecommunication Union – Digital Statistics
https://www.itu.int - Department of Foreign Affairs Philippines – Bilateral Relations
https://www.dfa.gov.ph - Philippine Statistics Authority – Trade Planning Division
https://psa.gov.ph (Philippines-Bangladesh trade estimates) - UN Comtrade Database – Philippines-Bangladesh Bilateral Trade
https://comtrade.un.org - Bangko Sentral ng Pilipinas – Payment Systems
https://www.bsp.gov.ph - Department of Foreign Affairs Philippines – International Cooperation
https://www.dfa.gov.ph/international-relations - Commission on Higher Education Philippines – International Admissions
https://www.ched.gov.ph - Department of Labor & Employment – Overseas Employment
https://www.dole.gov.ph - Bureau of Immigration Philippines – Visa Information
https://www.immigration.gov.ph - Department of Trade & Industry Philippines – Business Registration
https://www.dti.gov.ph - Philippine Chamber of Commerce & Industry – Import Market Analysis
https://www.pcci.org.ph - Board of Investments Philippines – Investment Opportunities
https://www.boi.gov.ph - Department of Science & Technology Philippines
https://www.dost.gov.ph - Philippine Retailers Association
https://www.pra.org.ph - Bangladesh Ministry of Commerce – Trade Policy
https://www.mincom.gov.bd